NMS Tritium in Atmospheric Water Vapour
Text description
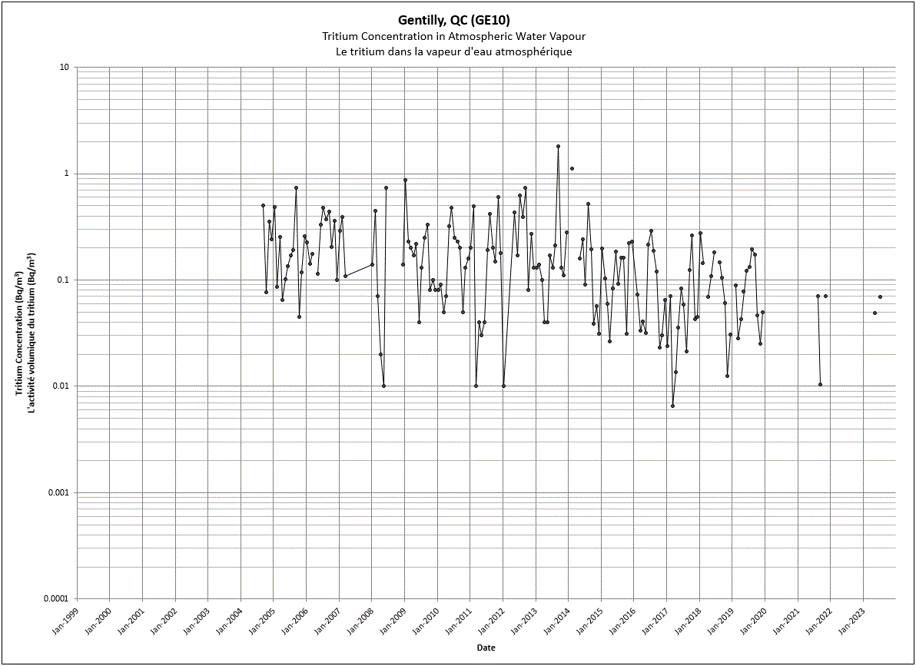
The above graph shows the concentration of tritium in water vapour from Gentilly, QC (GE10), from 2000 to present. The complete data set can be found in nms_tritium_vapour_ssn_tritium_vapeur.csv. If you require a specific accessible format, please contact us at hc.rpb-brp.sc@canada.ca.
Text description
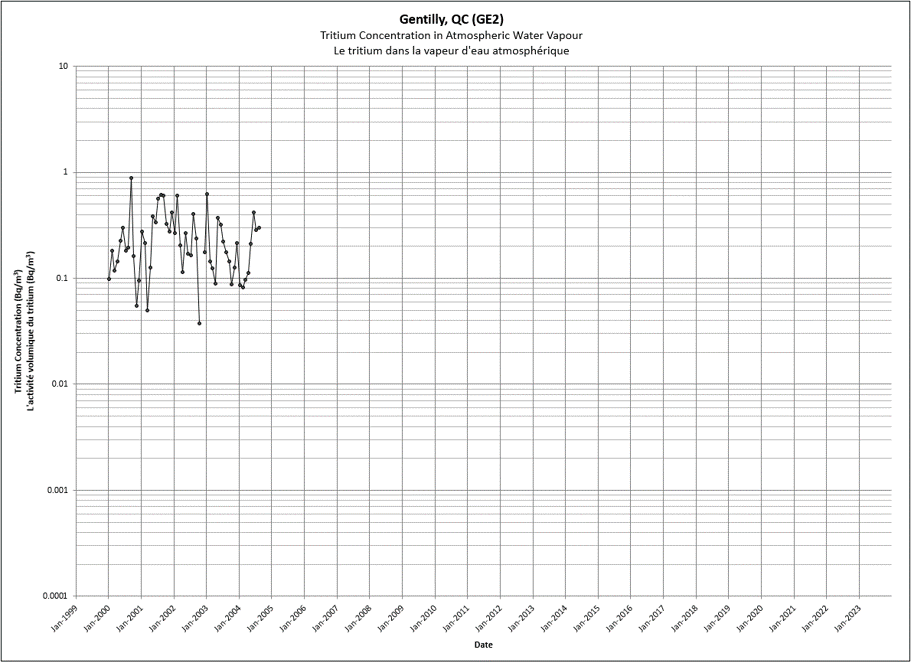
The above graph shows the concentration of tritium in water vapour from Gentilly, QC (GE2), from 2000 to present. The complete data set can be found in nms_tritium_vapour_ssn_tritium_vapeur.csv. If you require a specific accessible format, please contact us at hc.rpb-brp.sc@canada.ca.
Text description
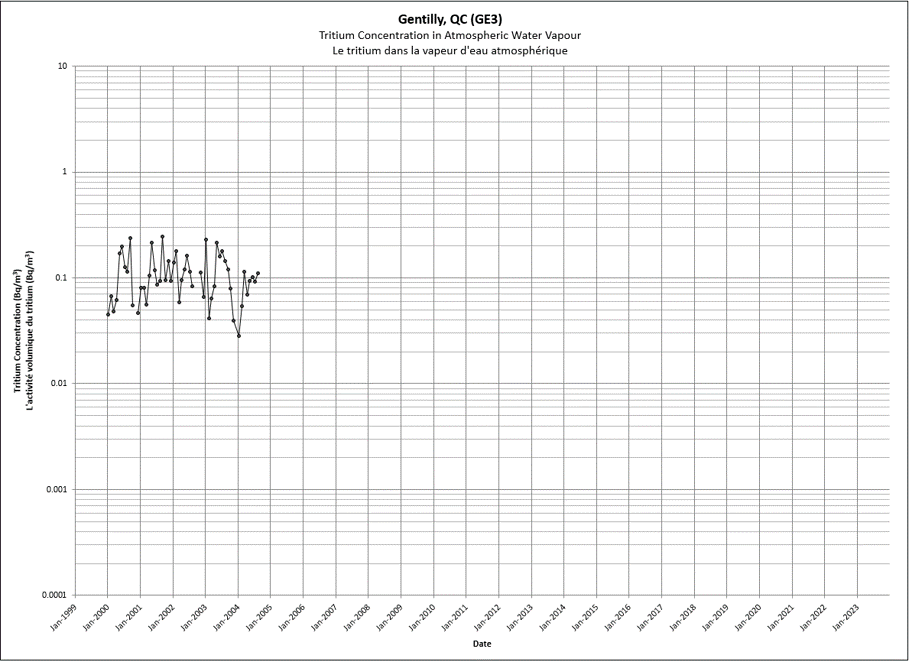
The above graph shows the concentration of tritium in water vapour from Gentilly, QC (GE3),from 2000 to present. The complete data set can be found in nms_tritium_vapour_ssn_tritium_vapeur.csv. If you require a specific accessible format, please contact us at hc.rpb-brp.sc@canada.ca.

Text description
The above graph shows the concentration of tritium in water vapour from Gentilly, QC (GE4),from 2000 to present. The complete data set can be found in nms_tritium_vapour_ssn_tritium_vapeur.csv. If you require a specific accessible format, please contact us at hc.rpb-brp.sc@canada.ca.
Text description
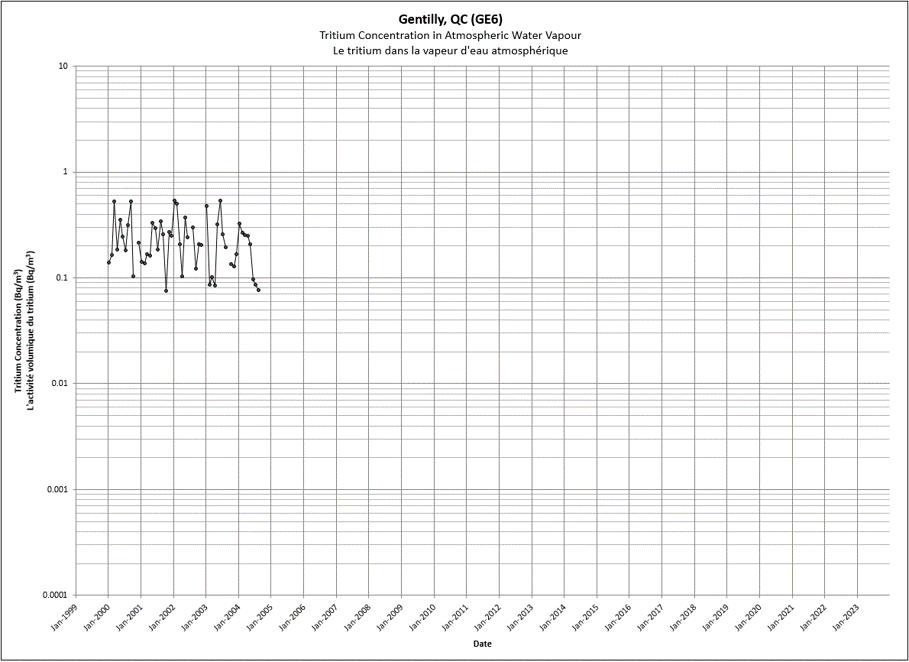
The above graph shows the concentration of tritium in water vapour from Gentilly, QC (GE6),from 2000 to present. The complete data set can be found in nms_tritium_vapour_ssn_tritium_vapeur.csv. If you require a specific accessible format, please contact us at hc.rpb-brp.sc@canada.ca.
Text description
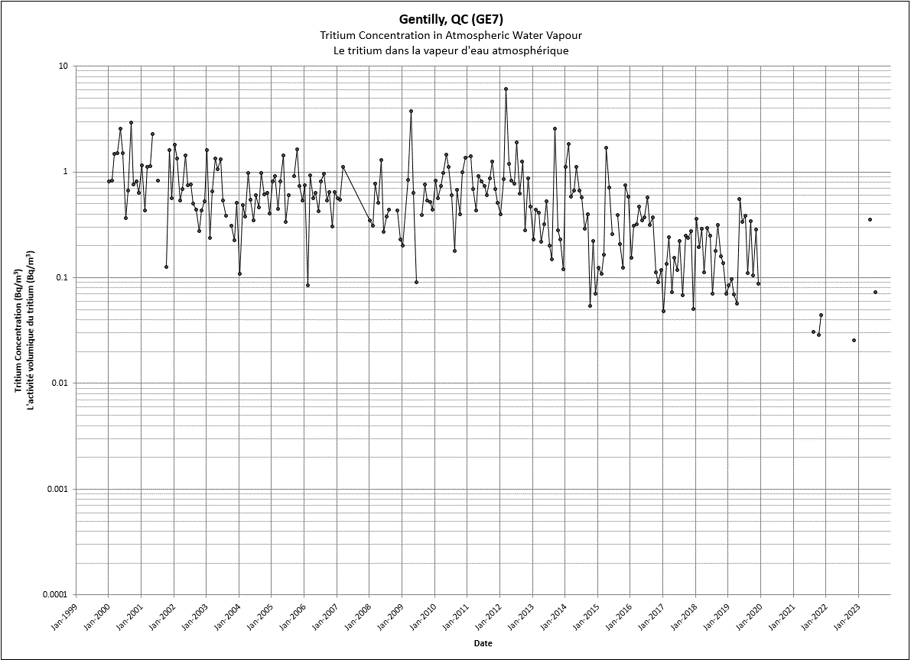
The above graph shows the concentration of tritium in water vapour from Gentilly, QC (GE7),from 2000 to present. The complete data set can be found in nms_tritium_vapour_ssn_tritium_vapeur.csv. If you require a specific accessible format, please contact us at hc.rpb-brp.sc@canada.ca.
Text description
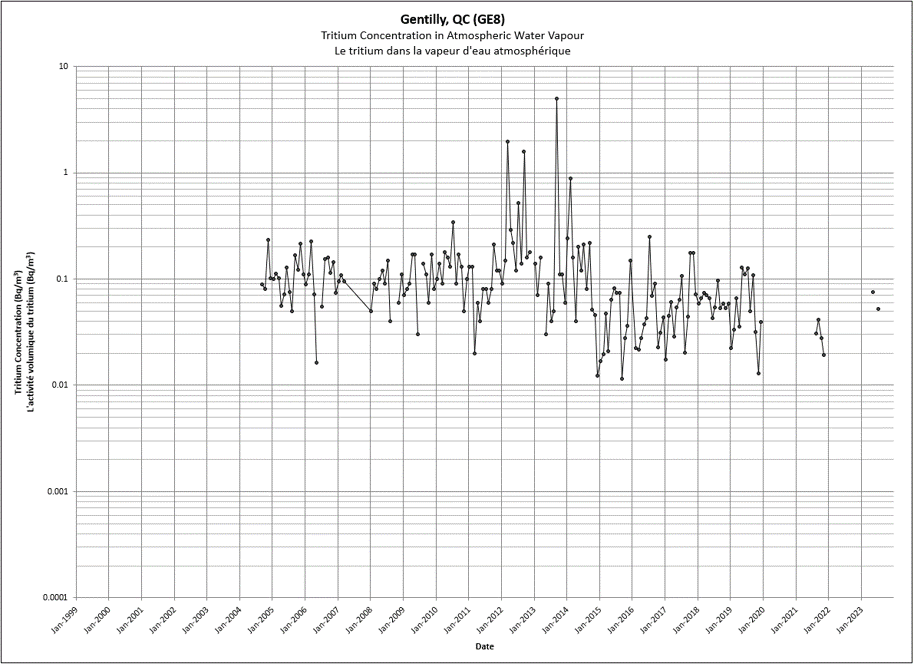
The above graph shows the concentration of tritium in water vapour from Gentilly, QC (GE8),from 2000 to present. The complete data set can be found in nms_tritium_vapour_ssn_tritium_vapeur.csv. If you require a specific accessible format, please contact us at hc.rpb-brp.sc@canada.ca.
Text description
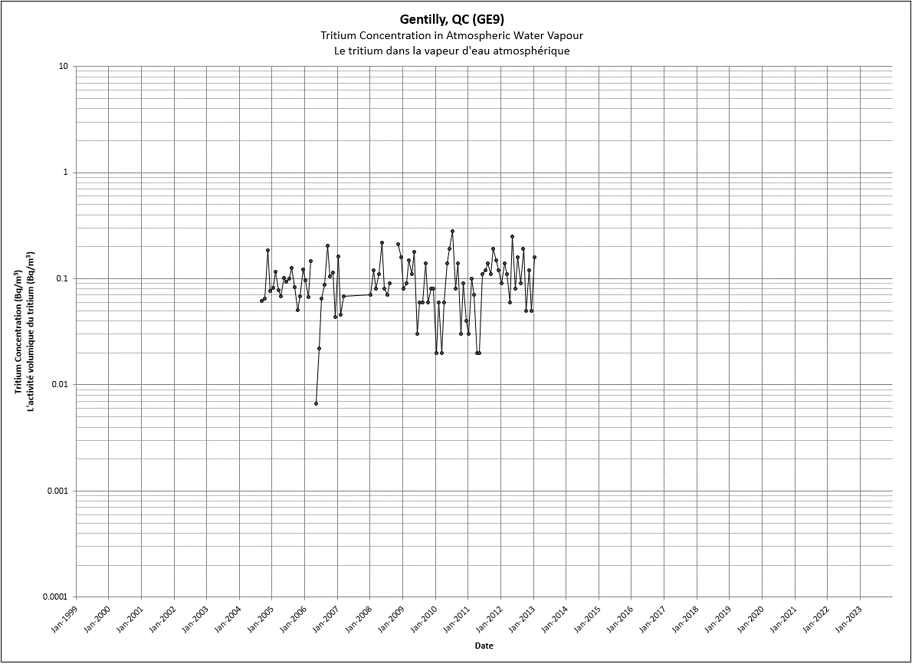
The above graph shows the concentration of tritium in water vapour from Gentilly, QC (GE9),from 2000 to present. The complete data set can be found in nms_tritium_vapour_ssn_tritium_vapeur.csv. If you require a specific accessible format, please contact us at hc.rpb-brp.sc@canada.ca.
Text description
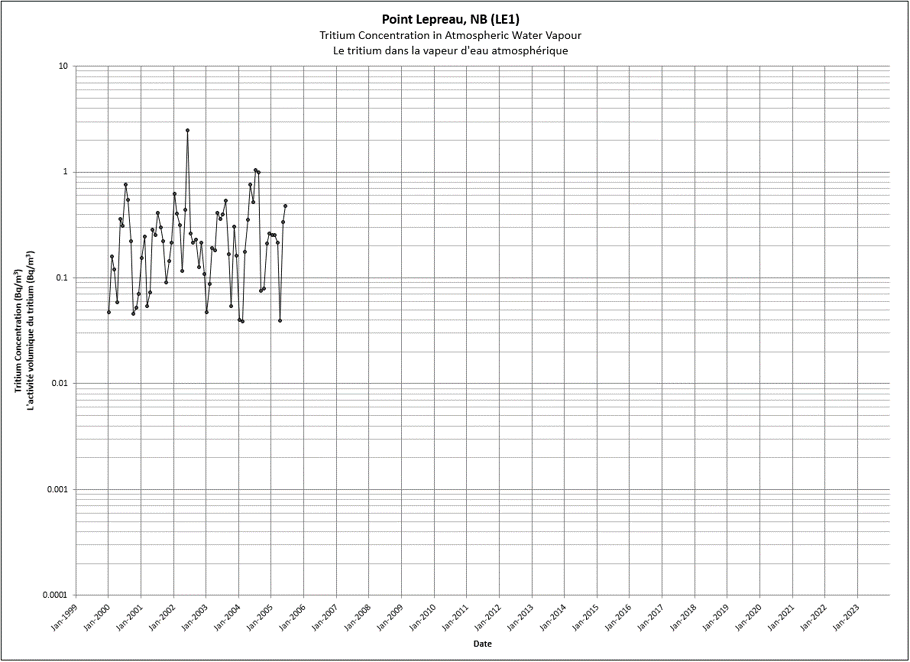
The above graph shows the concentration of tritium in water vapour from Point Lepreau, NB (LE1),from 2000 to present. The complete data set can be found in nms_tritium_vapour_ssn_tritium_vapeur.csv. If you require a specific accessible format, please contact us at hc.rpb-brp.sc@canada.ca.
Text description
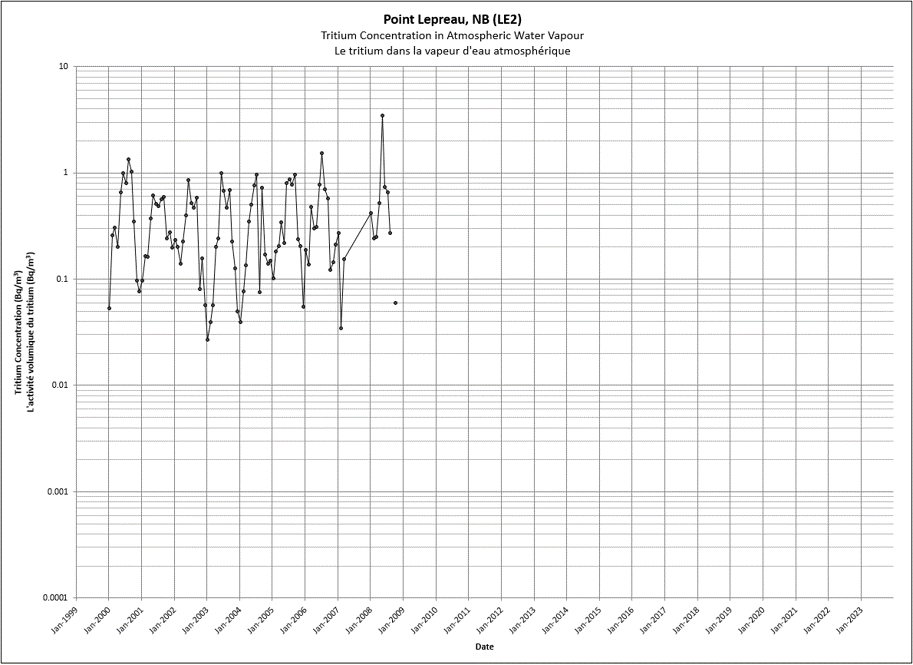
The above graph shows the concentration of tritium in water vapour from Point Lepreau, NB (LE2),from 2000 to present. The complete data set can be found in nms_tritium_vapour_ssn_tritium_vapeur.csv. If you require a specific accessible format, please contact us at hc.rpb-brp.sc@canada.ca.
Text description
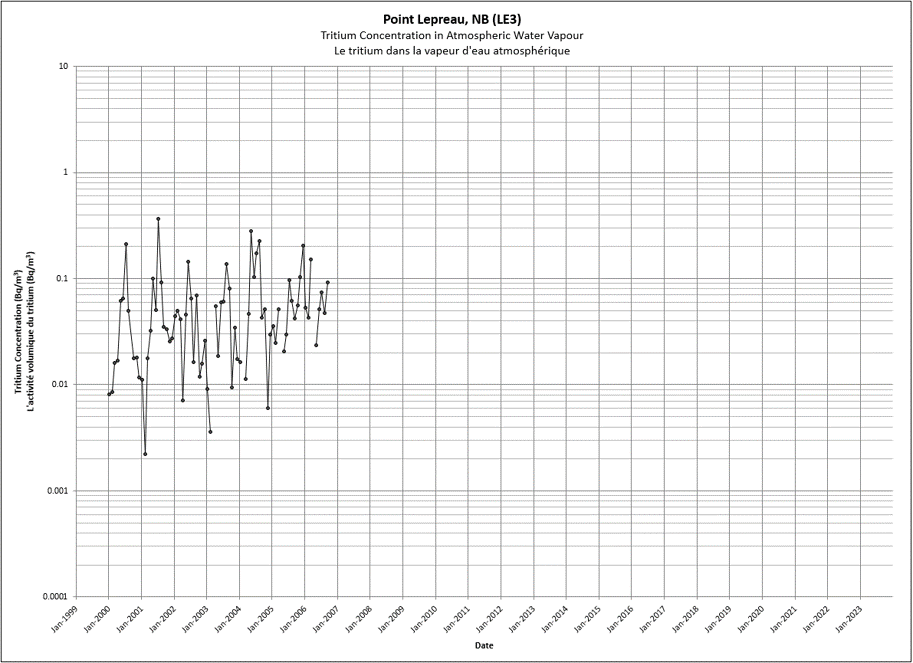
The above graph shows the concentration of tritium in water vapour from Point Lepreau, NB (LE3),from 2000 to present. The complete data set can be found in nms_tritium_vapour_ssn_tritium_vapeur.csv. If you require a specific accessible format, please contact us at hc.rpb-brp.sc@canada.ca.
Text description
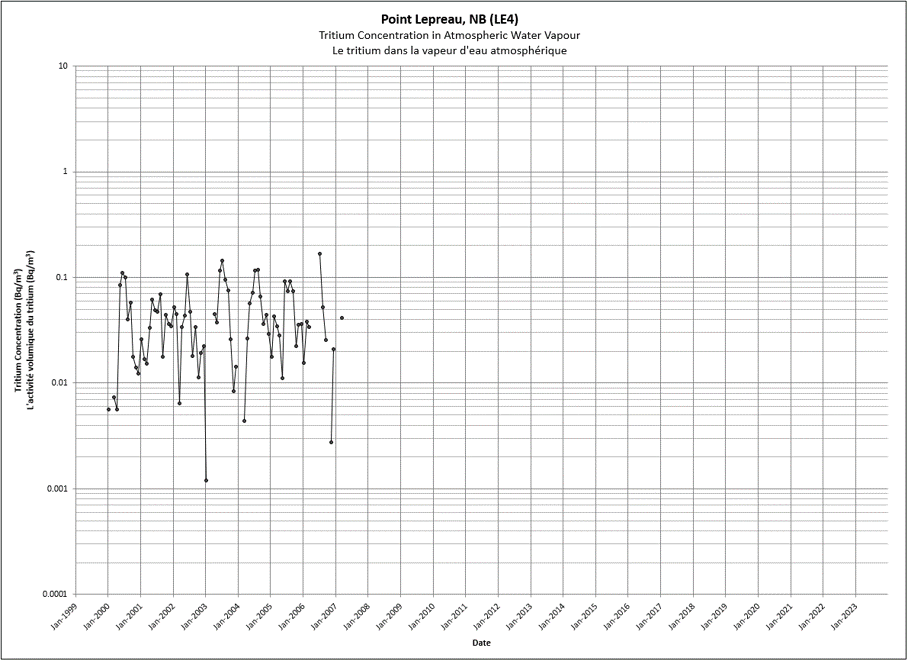
The above graph shows the concentration of tritium in water vapour from Point Lepreau, NB (LE4),from 2000 to present. The complete data set can be found in nms_tritium_vapour_ssn_tritium_vapeur.csv. If you require a specific accessible format, please contact us at hc.rpb-brp.sc@canada.ca.
Text description
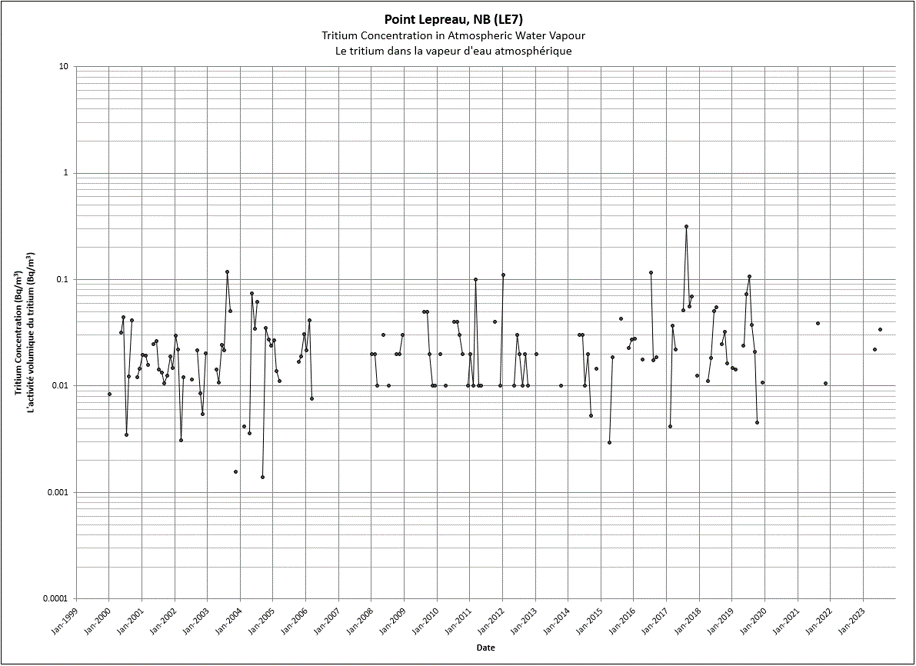
The above graph shows the concentration of tritium in water vapour from Point Lepreau, NB (LE7),from 2000 to present. The complete data set can be found in nms_tritium_vapour_ssn_tritium_vapeur.csv. If you require a specific accessible format, please contact us at hc.rpb-brp.sc@canada.ca.
Text description
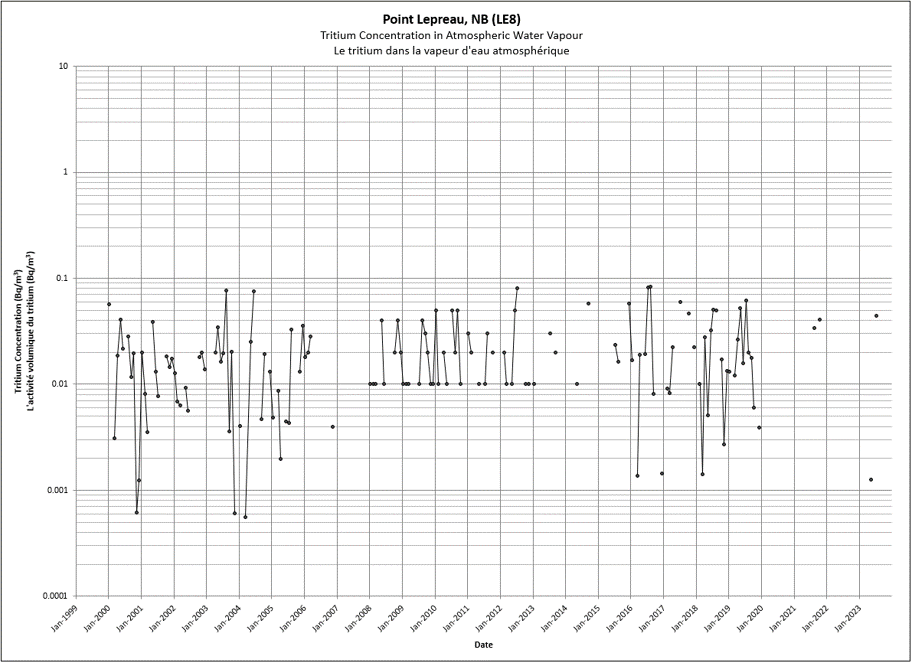
The above graph shows the concentration of tritium in water vapour from Point Lepreau, NB (LE8),from 2000 to present. The complete data set can be found in nms_tritium_vapour_ssn_tritium_vapeur.csv. If you require a specific accessible format, please contact us at hc.rpb-brp.sc@canada.ca.
Text description
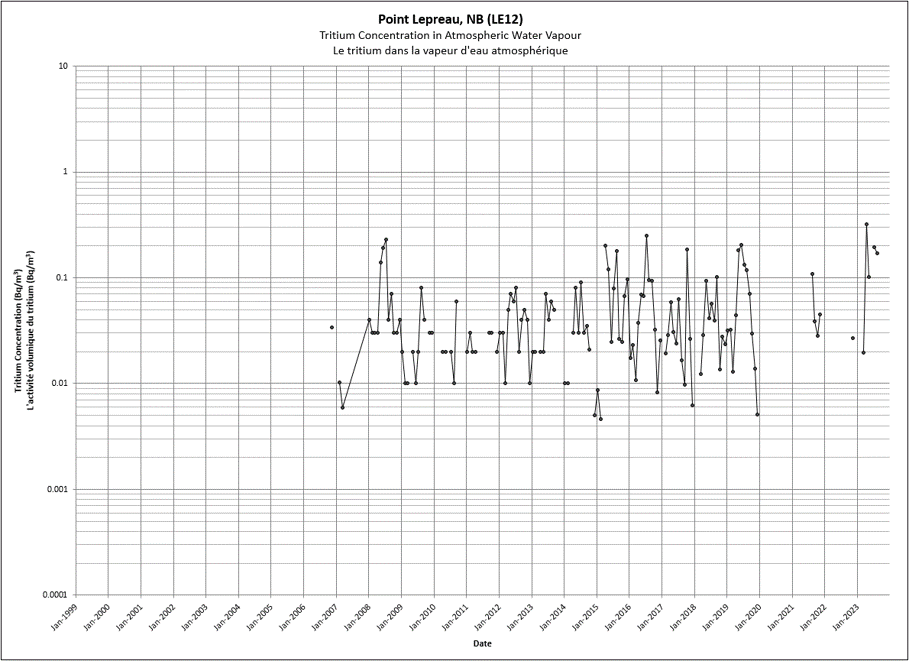
The above graph shows the concentration of tritium in water vapour from Point Lepreau, NB (LE12),from 2000 to present. The complete data set can be found in nms_tritium_vapour_ssn_tritium_vapeur.csv. If you require a specific accessible format, please contact us at hc.rpb-brp.sc@canada.ca.
Text description
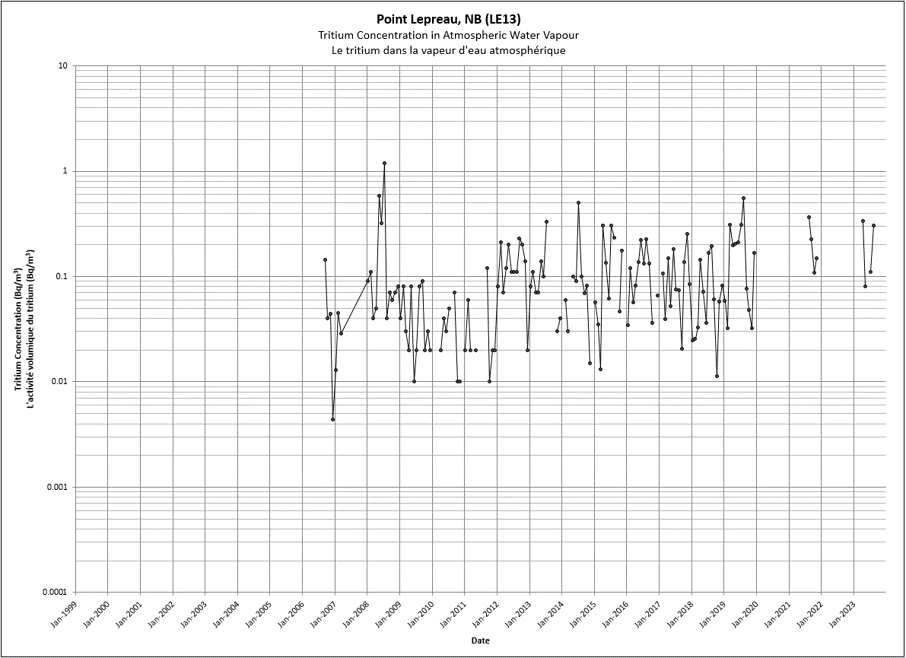
The above graph shows the concentration of tritium in water vapour from Point Lepreau, NB (LE13),from 2000 to present. The complete data set can be found in nms_tritium_vapour_ssn_tritium_vapeur.csv. If you require a specific accessible format, please contact us at hc.rpb-brp.sc@canada.ca.
Text description
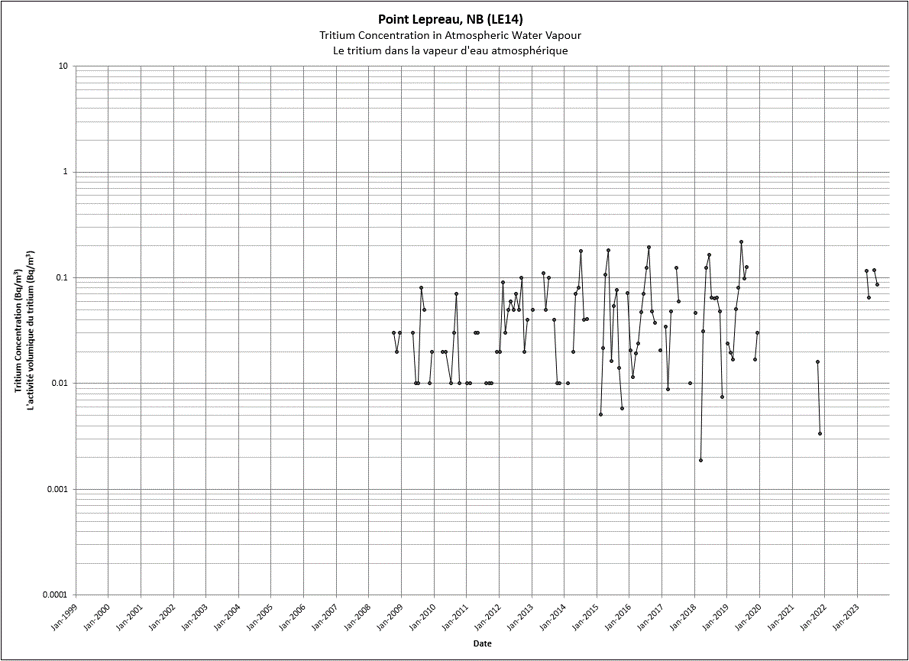
The above graph shows the concentration of tritium in water vapour from Point Lepreau, NB (LE14),from 2000 to present. The complete data set can be found in nms_tritium_vapour_ssn_tritium_vapeur.csv. If you require a specific accessible format, please contact us at hc.rpb-brp.sc@canada.ca.
Text description
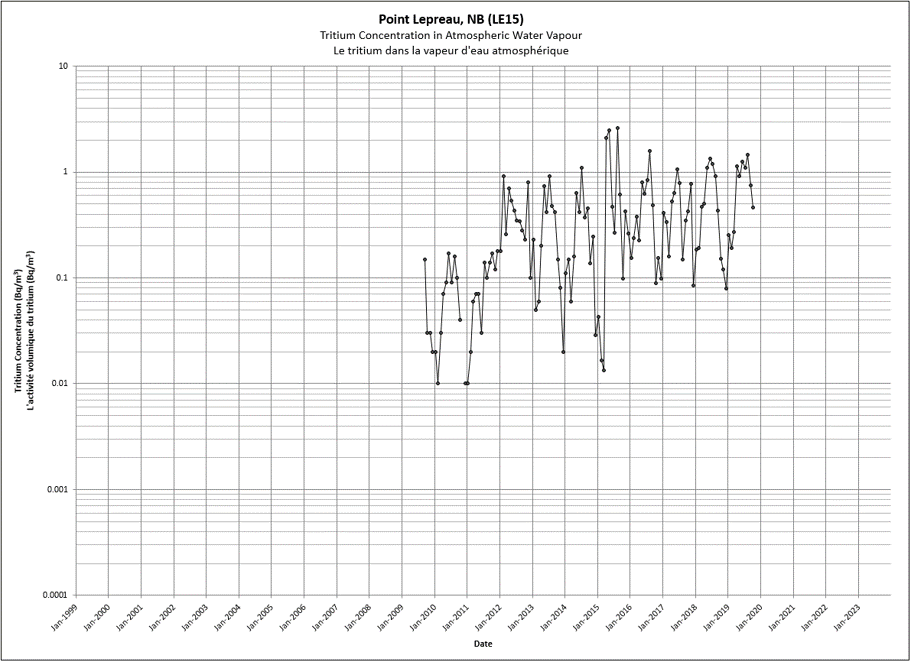
The above graph shows the concentration of tritium in water vapour from Point Lepreau, NB (LE15),from 2000 to present. The complete data set can be found in nms_tritium_vapour_ssn_tritium_vapeur.csv. If you require a specific accessible format, please contact us at hc.rpb-brp.sc@canada.ca.
Text description
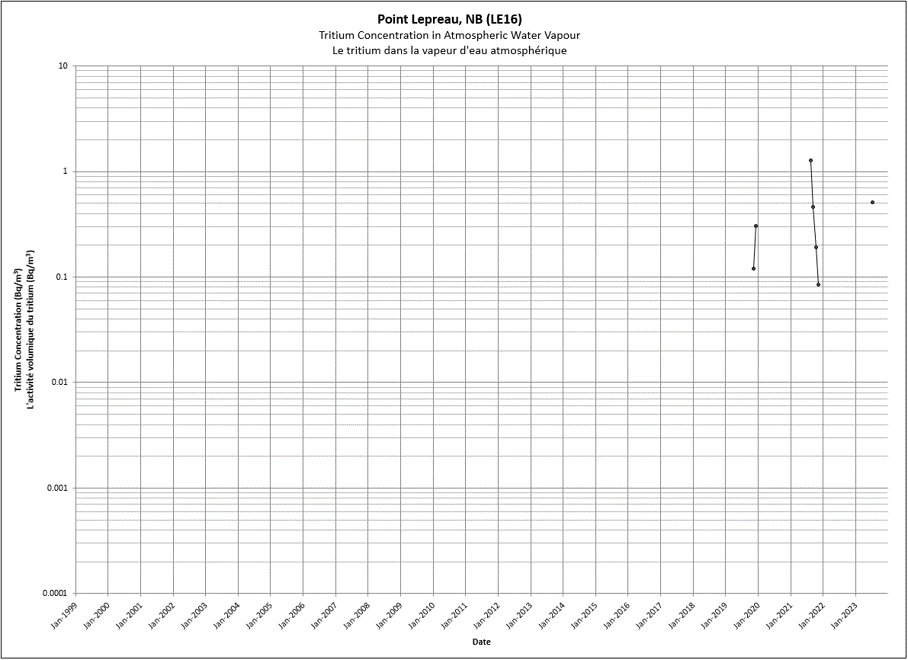
The above graph shows the concentration of tritium in water vapour from Point Lepreau, NB (LE16),from 2000 to present. The complete data set can be found in nms_tritium_vapour_ssn_tritium_vapeur.csv. If you require a specific accessible format, please contact us at hc.rpb-brp.sc@canada.ca.
Text description
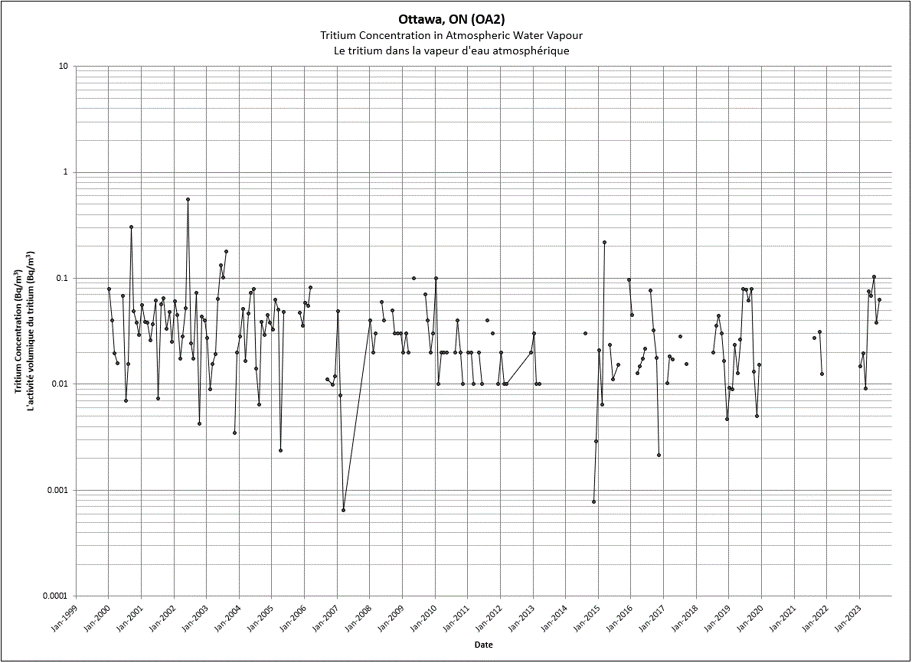
The above graph shows the concentration of tritium in water vapour from Ottawa, ON,from 2000 to present. The complete data set can be found in nms_tritium_vapour_ssn_tritium_vapeur.csv. If you require a specific accessible format, please contact us at hc.rpb-brp.sc@canada.ca.
Text description
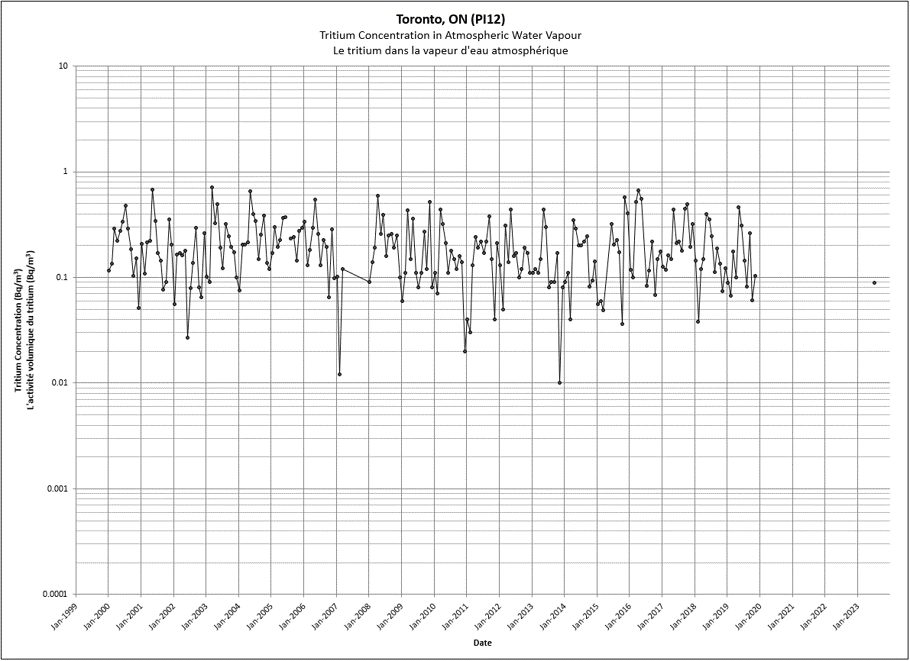
The above graph shows the concentration of tritium in water vapour from Toronto, ON,from 2000 to present. The complete data set can be found in nms_tritium_vapour_ssn_tritium_vapeur.csv. If you require a specific accessible format, please contact us at hc.rpb-brp.sc@canada.ca.