NMS Environmental Dosimetry Results
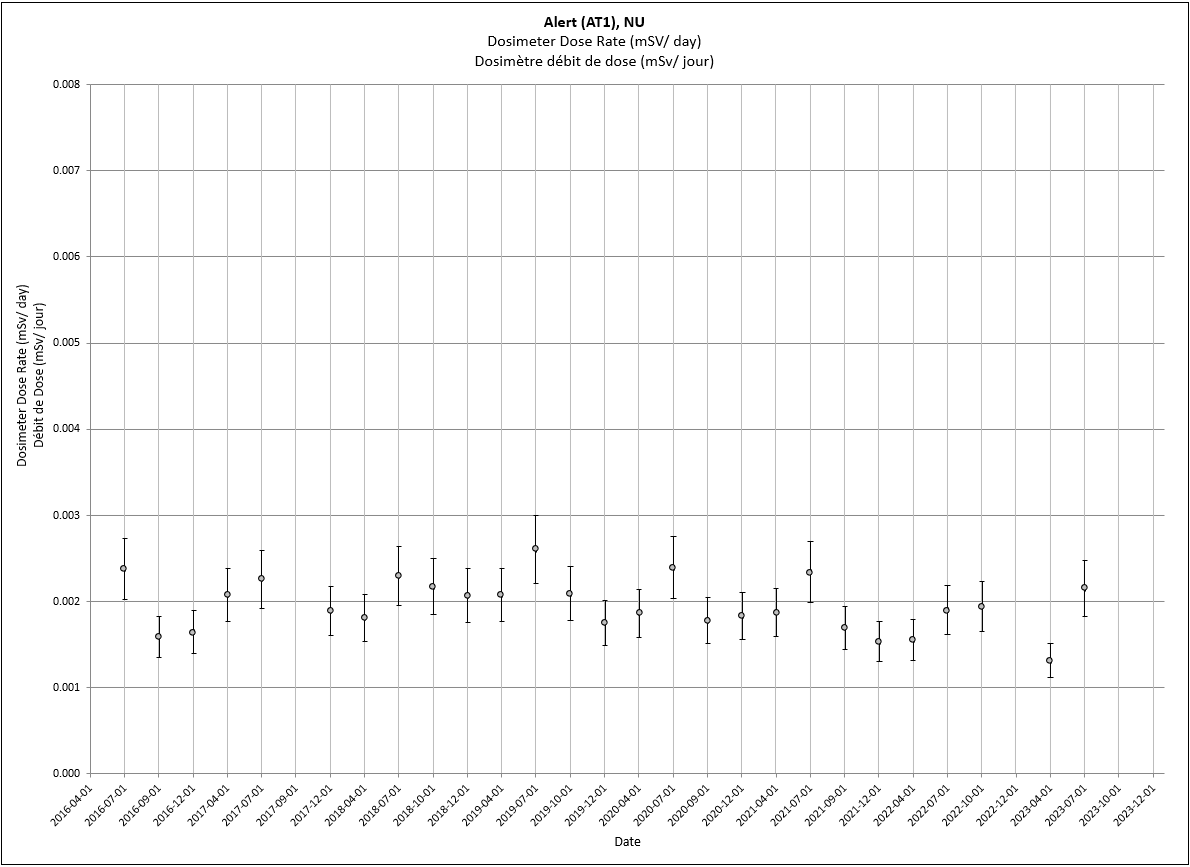
Text description
The above graph shows the background dose rate for Alert, NU, from 2016 to present. The entire data set can be found in nms_environmental_dosimetry_ssn_dosimetrie_environnementale.csv. If you require a copy of this data in a specific accessible format, please contact us at hc.rpb-brp.sc@canada.ca.
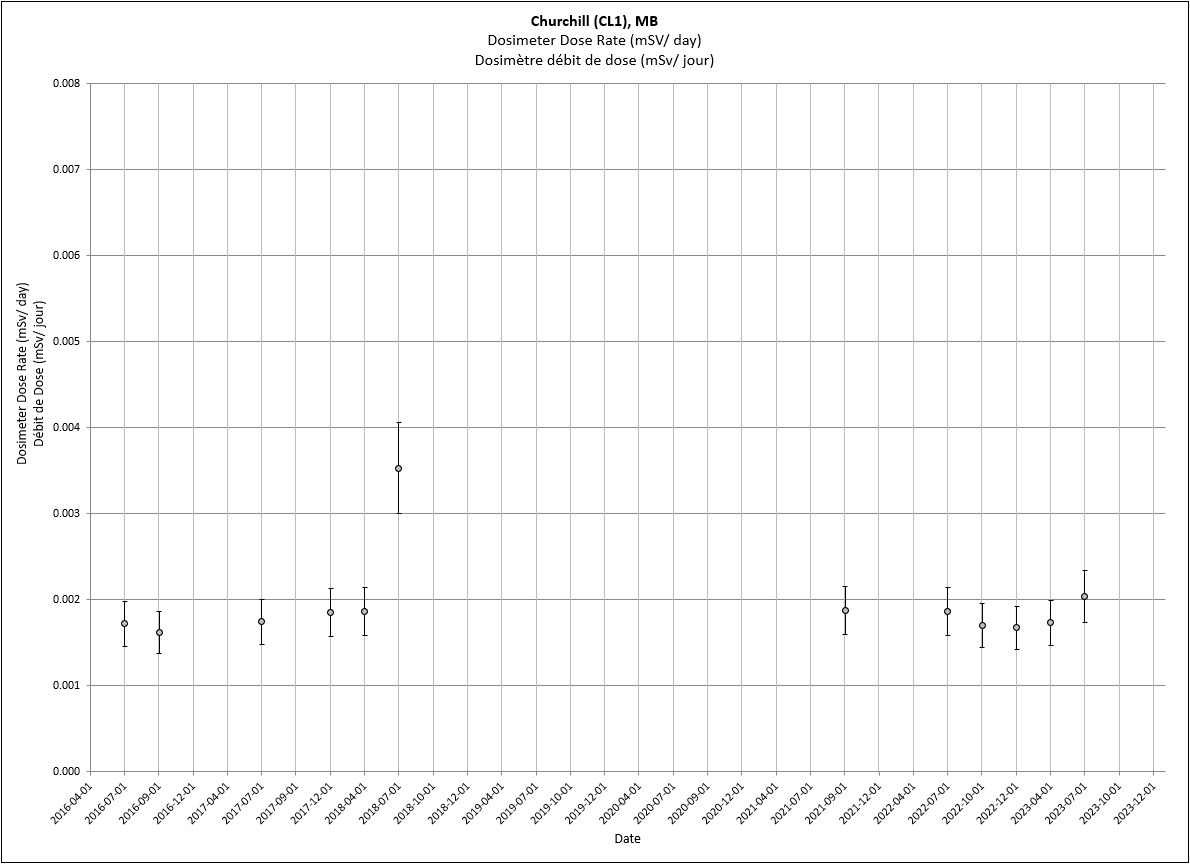
Text description
The above graph shows the background dose rate for Churchill, MB, from 2016 to present. The entire data set can be found in nms_environmental_dosimetry_ssn_dosimetrie_environnementale.csv. If you require a copy of this data in a specific accessible format, please contact us at hc.rpb-brp.sc@canada.ca.

Text description
The above graph shows the background dose rate for Charlottetown, PEI, from 2016 to present. The entire data set can be found in nms_environmental_dosimetry_ssn_dosimetrie_environnementale.csv. If you require a copy of this data in a specific accessible format, please contact us at hc.rpb-brp.sc@canada.ca.

Text description
The above graph shows the background dose rate for Coral Harbour, NU, from 2016 to present. The entire data set can be found in nms_environmental_dosimetry_ssn_dosimetrie_environnementale.csv. If you require a copy of this data in a specific accessible format, please contact us at hc.rpb-brp.sc@canada.ca.
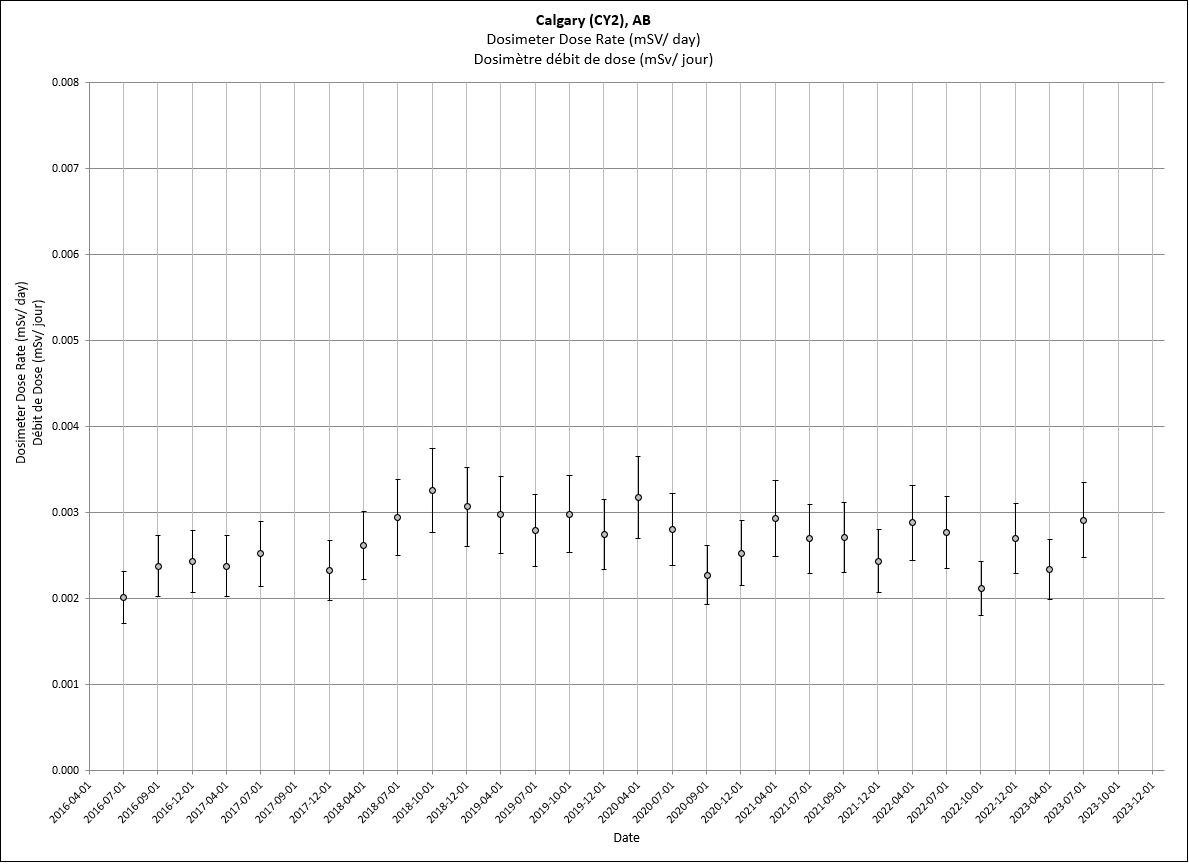
Text description
The above graph shows the background dose rate for Calgary, AB, from 2016 to present. The entire data set can be found in nms_environmental_dosimetry_ssn_dosimetrie_environnementale.csv. If you require a copy of this data in a specific accessible format, please contact us hc.rpb-brp.sc@canada.ca.
">at hc.rpb-brp.sc@canada.ca..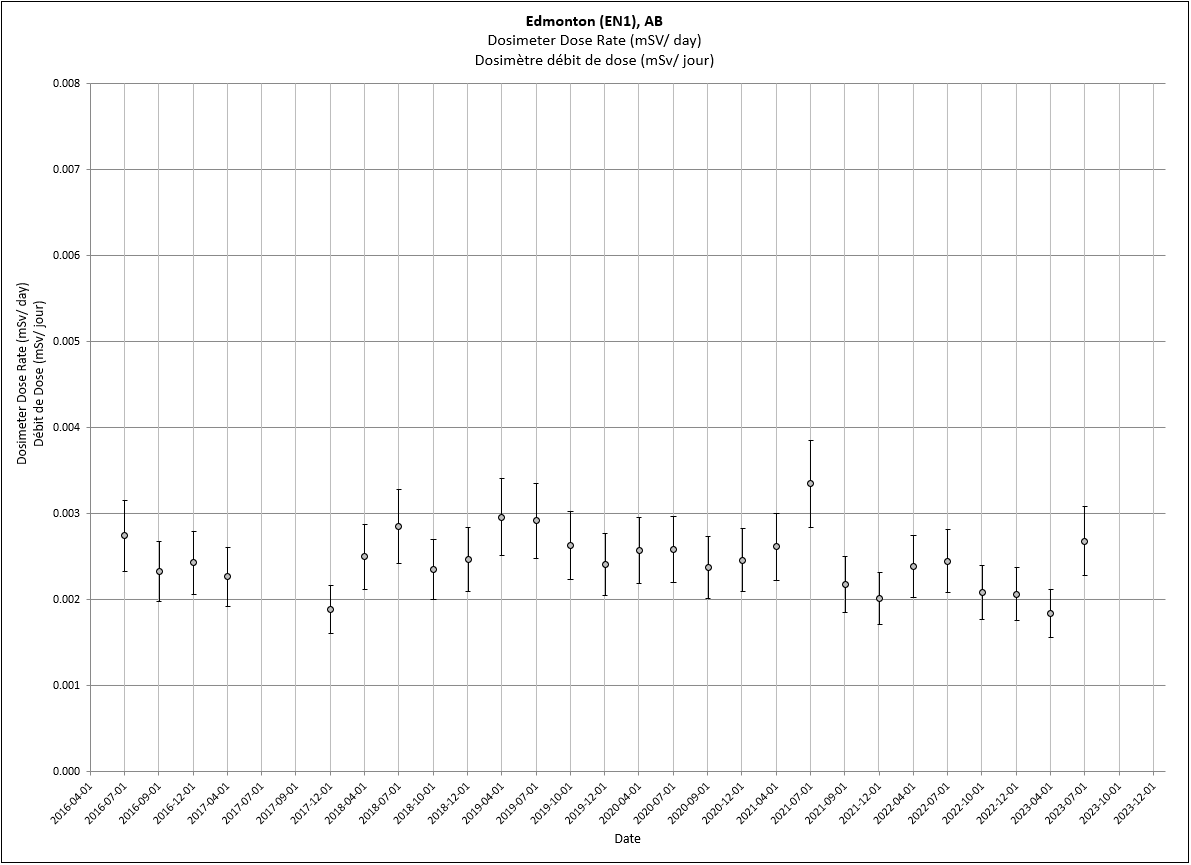
Text description
The above graph shows the background dose rate for Edmonton, AB, from 2016 to present. The entire data set can be found in nms_environmental_dosimetry_ssn_dosimetrie_environnementale.csv. If you require a copy of this data in a specific accessible format, please contact us us at hc.rpb-brp.sc@canada.ca.
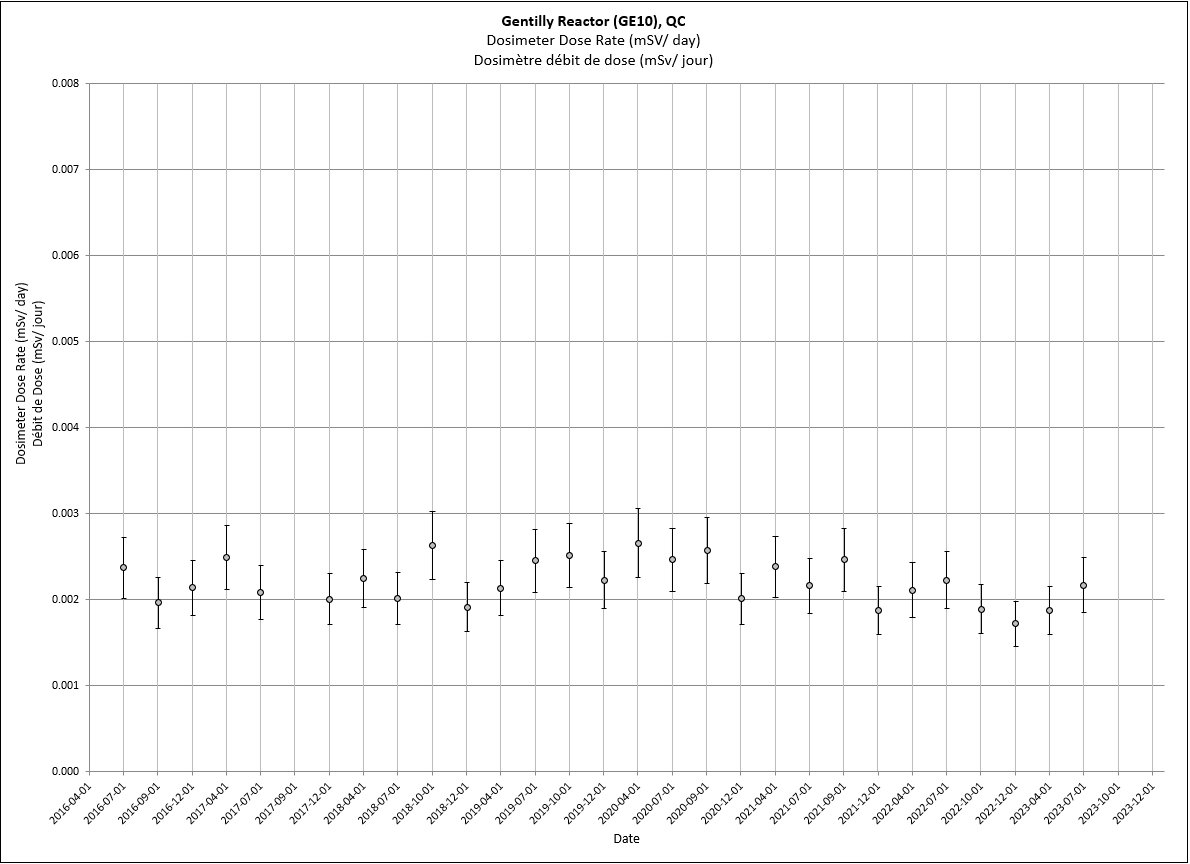
Text description
The above graph shows the background dose rate for Gentilly Reactor (GE10), QC, from 2016 to present. The entire data set can be found in nms_environmental_dosimetry_ssn_dosimetrie_environnementale.csv. If you require a copy of this data in a specific accessible format, please contact us at hc.rpb-brp.sc@canada.ca.
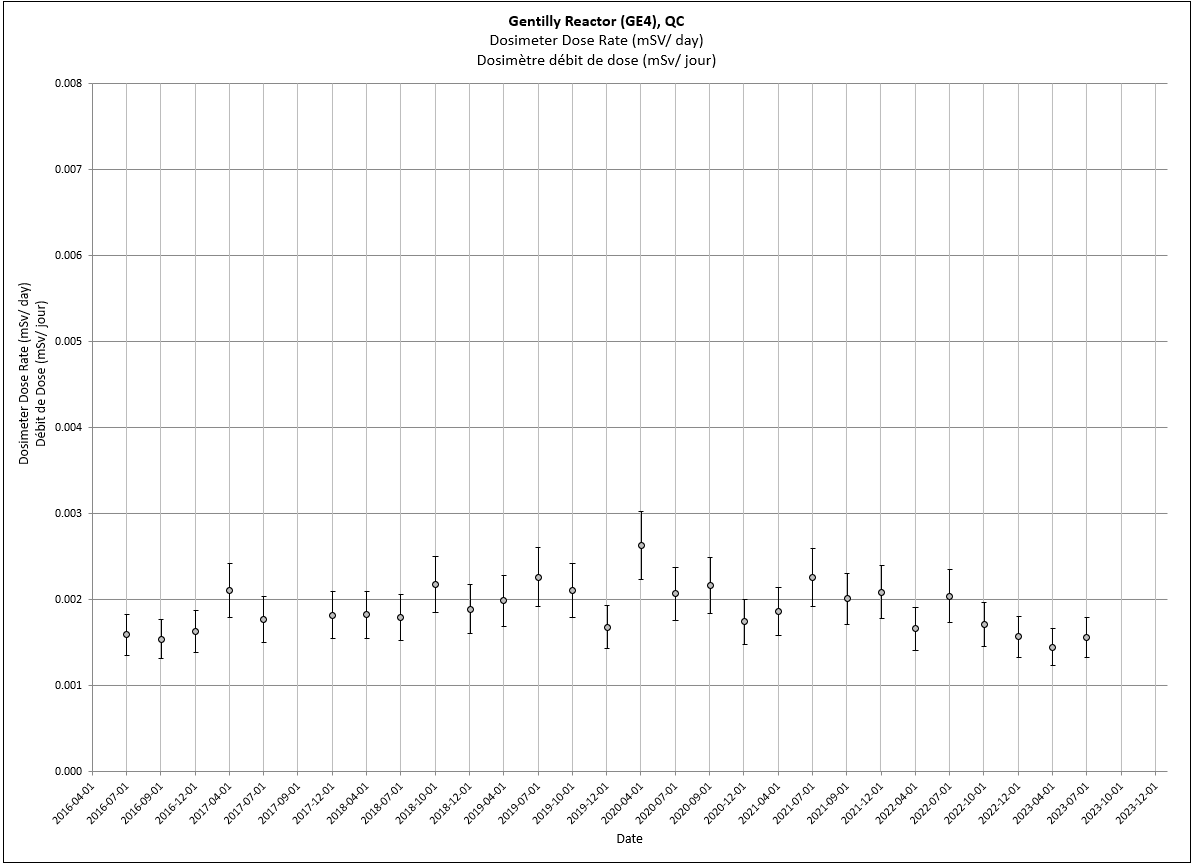
Text description
The above graph shows the background dose rate for Gentilly Reactor (GE4), QC, from 2016 to present. The entire data set can be found in nms_environmental_dosimetry_ssn_dosimetrie_environnementale.csv. If you require a copy of this data in a specific accessible format, please contact us at hc.rpb-brp.sc@canada.ca.
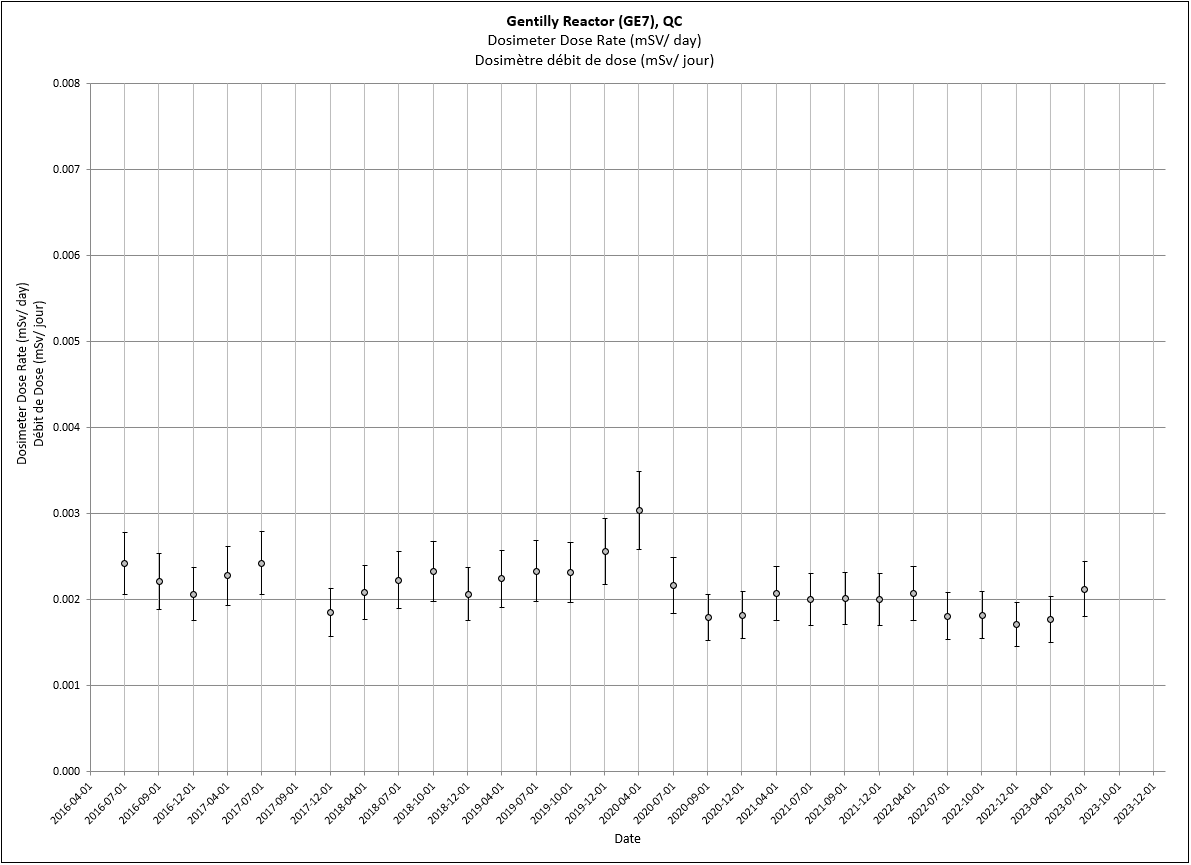
Text description
The above graph shows the background dose rate for Gentilly Reactor (GE7), QC, from 2016 to present. The entire data set can be found in nms_environmental_dosimetry_ssn_dosimetrie_environnementale.csv. If you require a copy of this data in a specific accessible format, please contact us at hc.rpb-brp.sc@canada.ca.
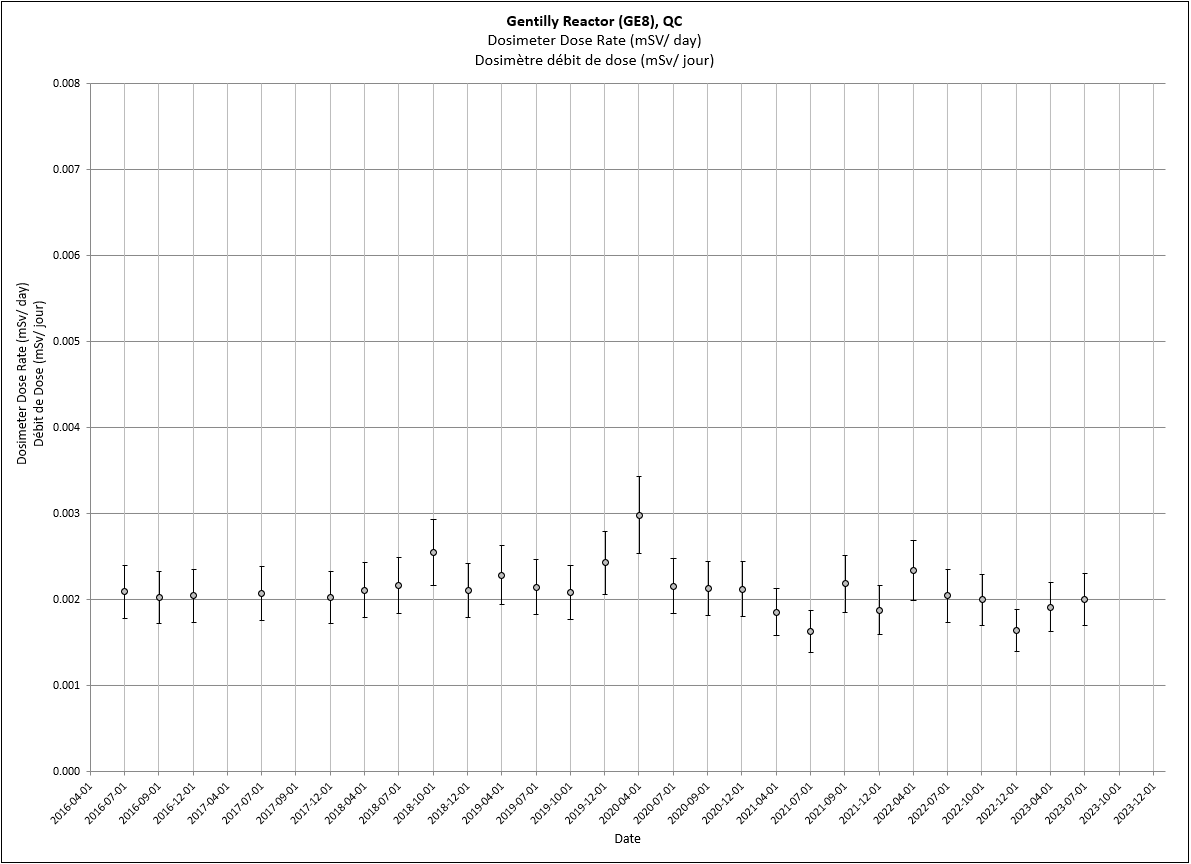
Text description
The above graph shows the background dose rate for Gentilly Reactor (GE8), QC, from 2016 to present. The entire data set can be found in nms_environmental_dosimetry_ssn_dosimetrie_environnementale.csv. If you require a copy of this data in a specific accessible format, please contact us at hc.rpb-brp.sc@canada.ca.

Text description
The above graph shows the background dose rate for Goose Bay, NL, from 2016 to present. The entire data set can be found in nms_environmental_dosimetry_ssn_dosimetrie_environnementale.csv. If you require a copy of this data in a specific accessible format, please contact us at hc.rpb-brp.sc@canada.ca.
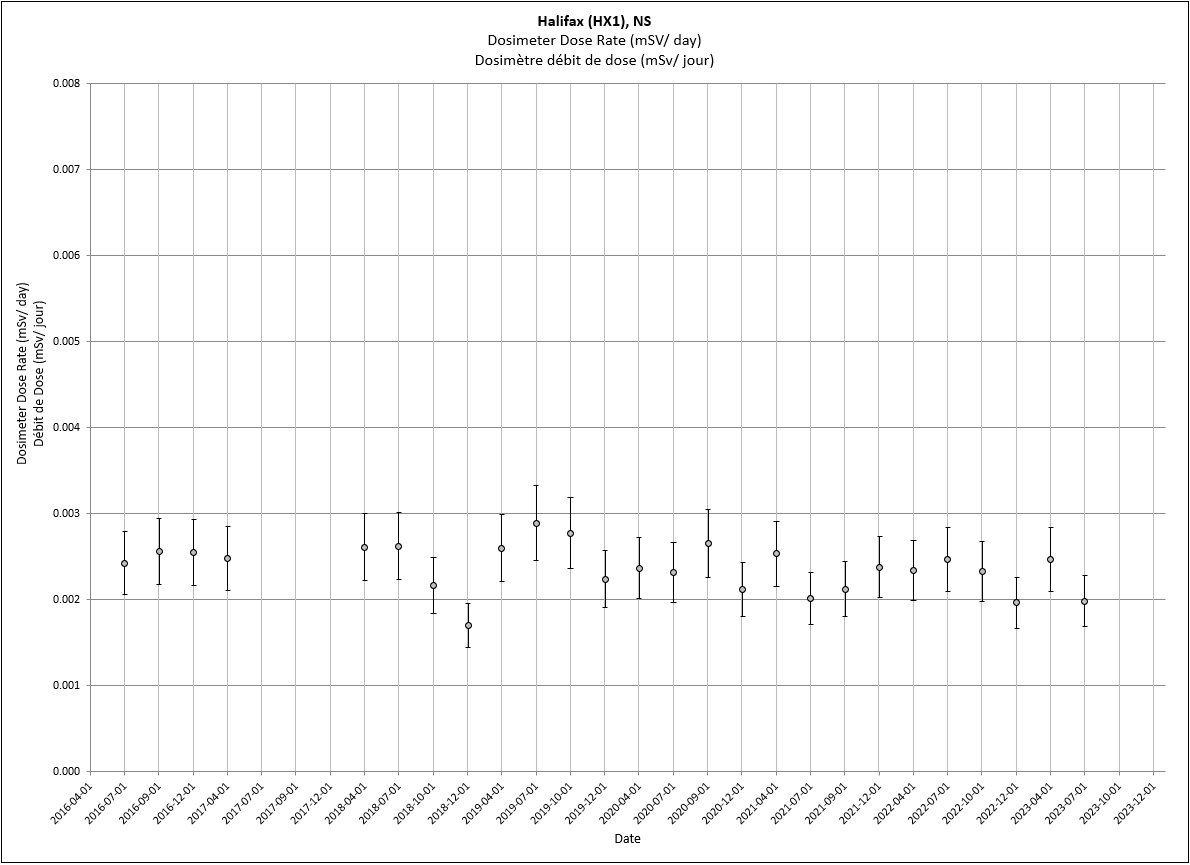
Text description
The above graph shows the background dose rate for Halifax, NS, from 2016 to present. The entire data set can be found in nms_environmental_dosimetry_ssn_dosimetrie_environnementale.csv. If you require a copy of this data in a specific accessible format, please contact us at hc.rpb-brp.sc@canada.ca.
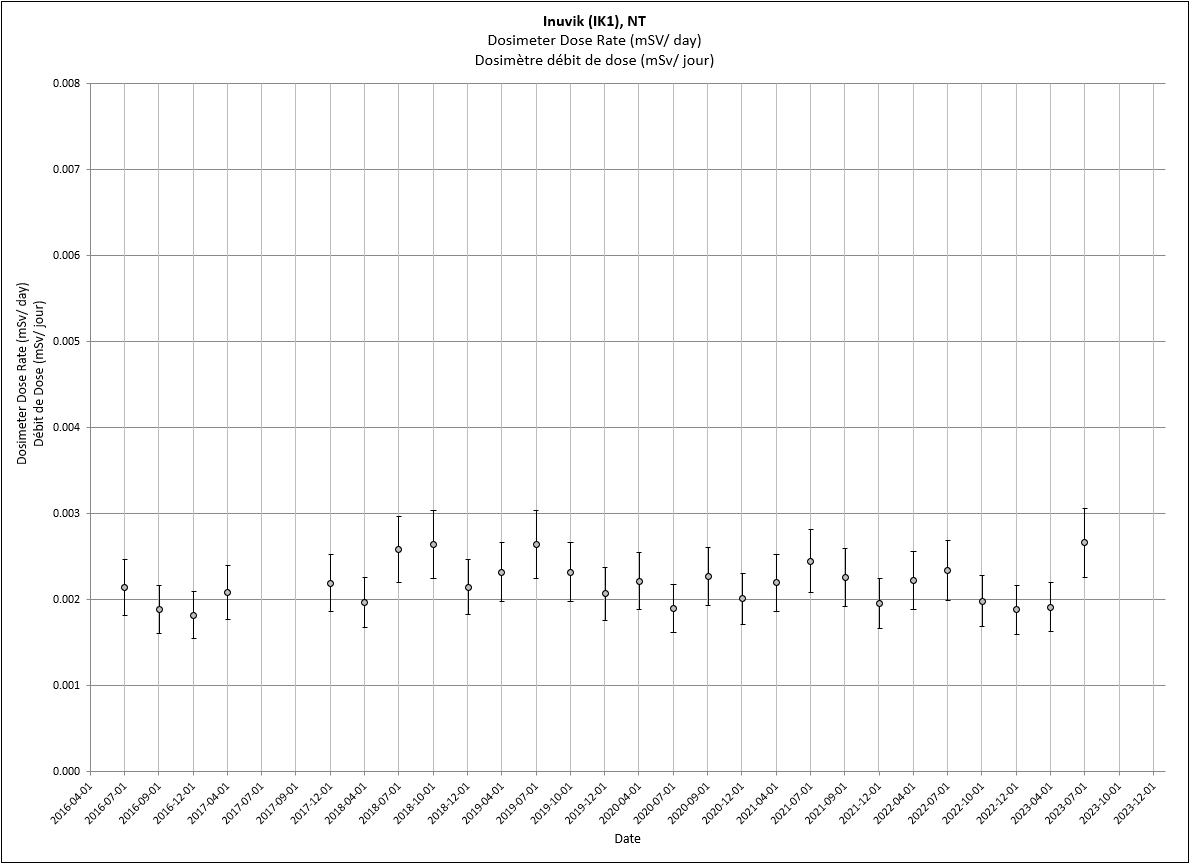
Text description
The above graph shows the background dose rate for Inuvik, NT, from 2016 to present. The entire data set can be found in nms_environmental_dosimetry_ssn_dosimetrie_environnementale.csv. If you require a copy of this data in a specific accessible format, please contact us at hc.rpb-brp.sc@canada.ca.
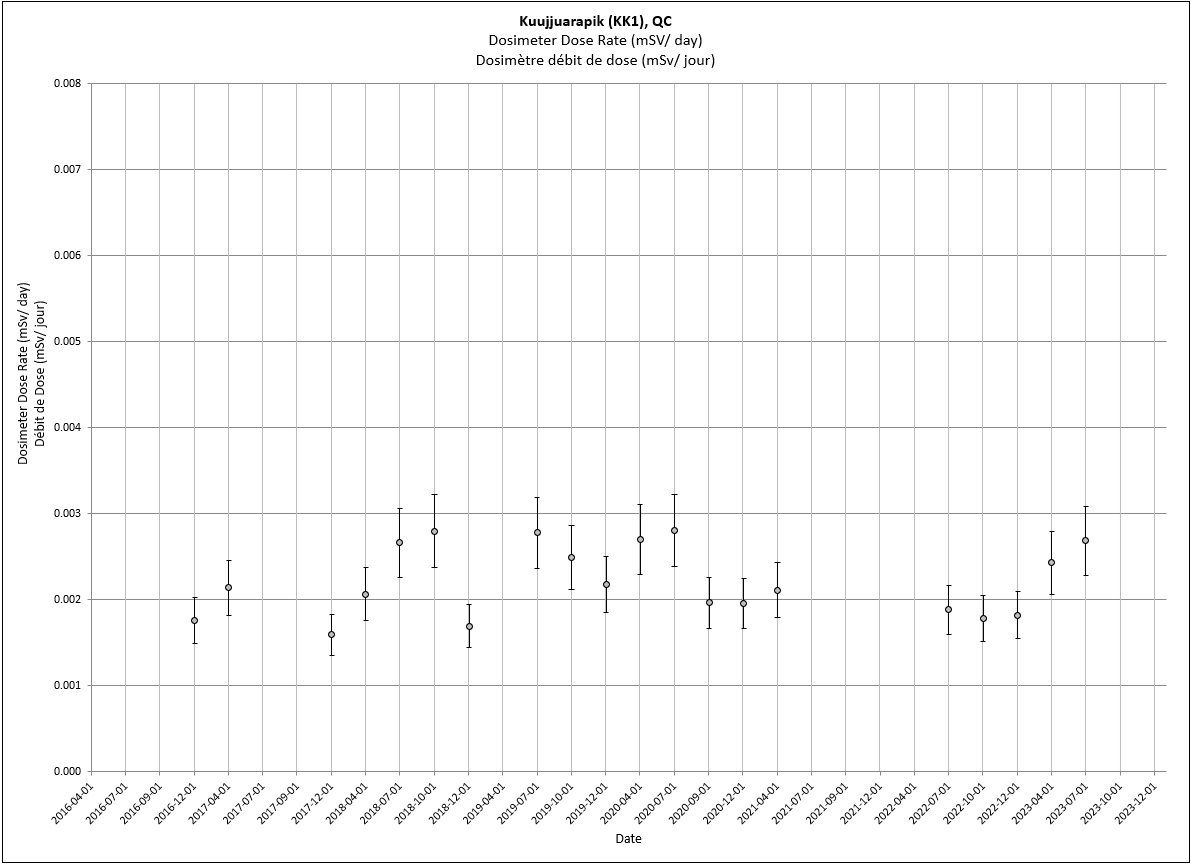
Text description
The above graph shows the background dose rate for Kuujjuarapik, QC, from 2016 to present. The entire data set can be found in nms_environmental_dosimetry_ssn_dosimetrie_environnementale.csv. If you require a copy of this data in a specific accessible format, please contact us at hc.rpb-brp.sc@canada.ca.
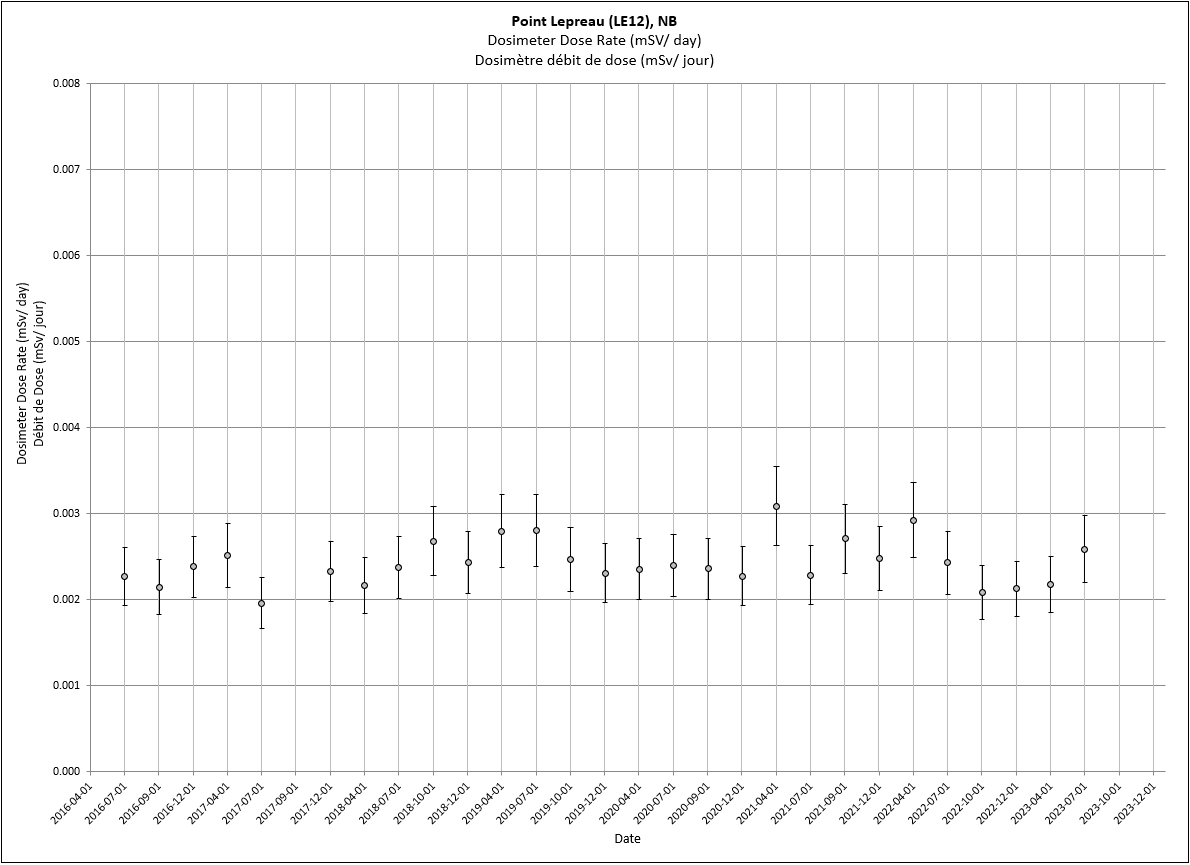
Text description
The above graph shows the background dose rate for Point Lepreau (LE12), NB, from 2016 to present. The entire data set can be found in nms_environmental_dosimetry_ssn_dosimetrie_environnementale.csv. If you require a copy of this data in a specific accessible format, please contact us at hc.rpb-brp.sc@canada.ca.

Text description
The above graph shows the background dose rate for Point Lepreau (LE13), NB, from 2016 to present. The entire data set can be found in nms_environmental_dosimetry_ssn_dosimetrie_environnementale.csv. If you require a copy of this data in a specific accessible format, please contact us at hc.rpb-brp.sc@canada.ca.

Text description
The above graph shows the background dose rate for Point Lepreau (LE14), NB, from 2016 to present. The entire data set can be found in nms_environmental_dosimetry_ssn_dosimetrie_environnementale.csv. If you require a copy of this data in a specific accessible format, please contact us at hc.rpb-brp.sc@canada.ca.
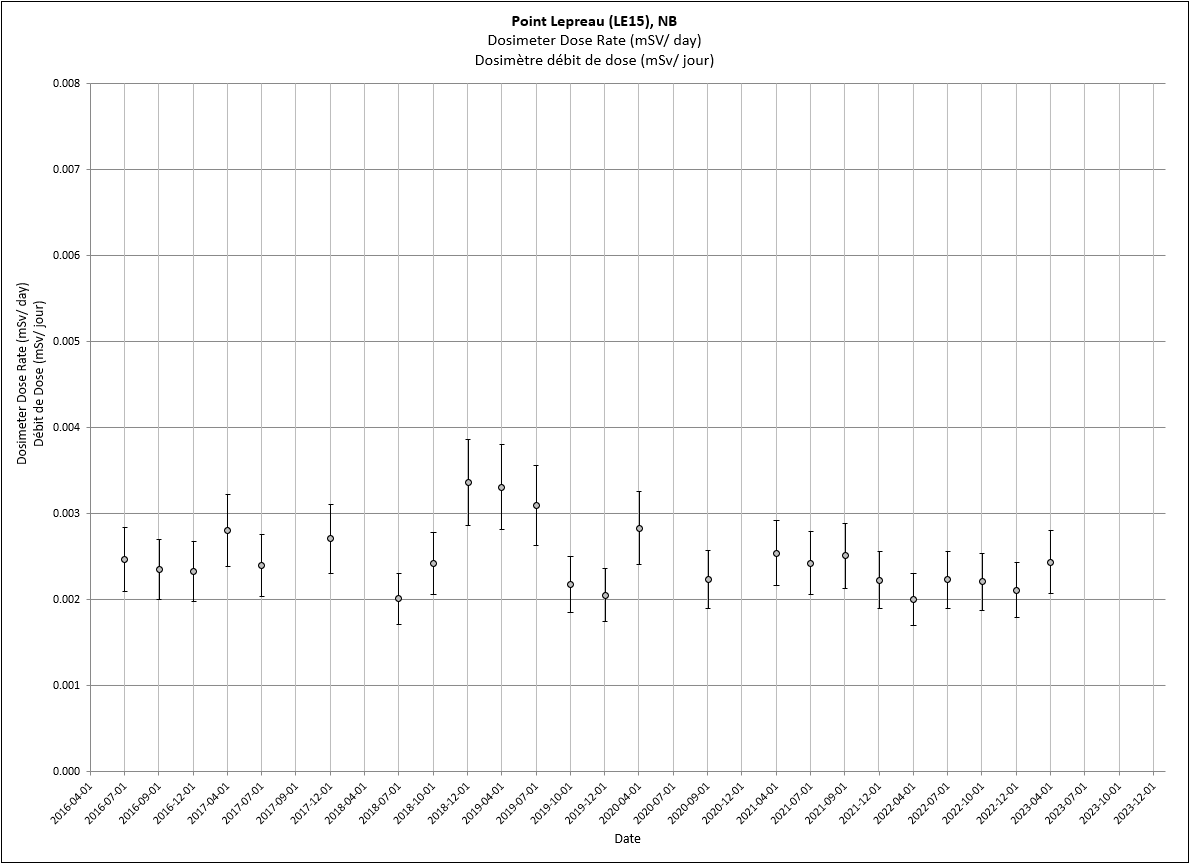
Text description
The above graph shows the background dose rate for Point Lepreau (LE15), NB, from 2016 to present. The entire data set can be found in nms_environmental_dosimetry_ssn_dosimetrie_environnementale.csv. If you require a copy of this data in a specific accessible format, please contact us at hc.rpb-brp.sc@canada.ca.
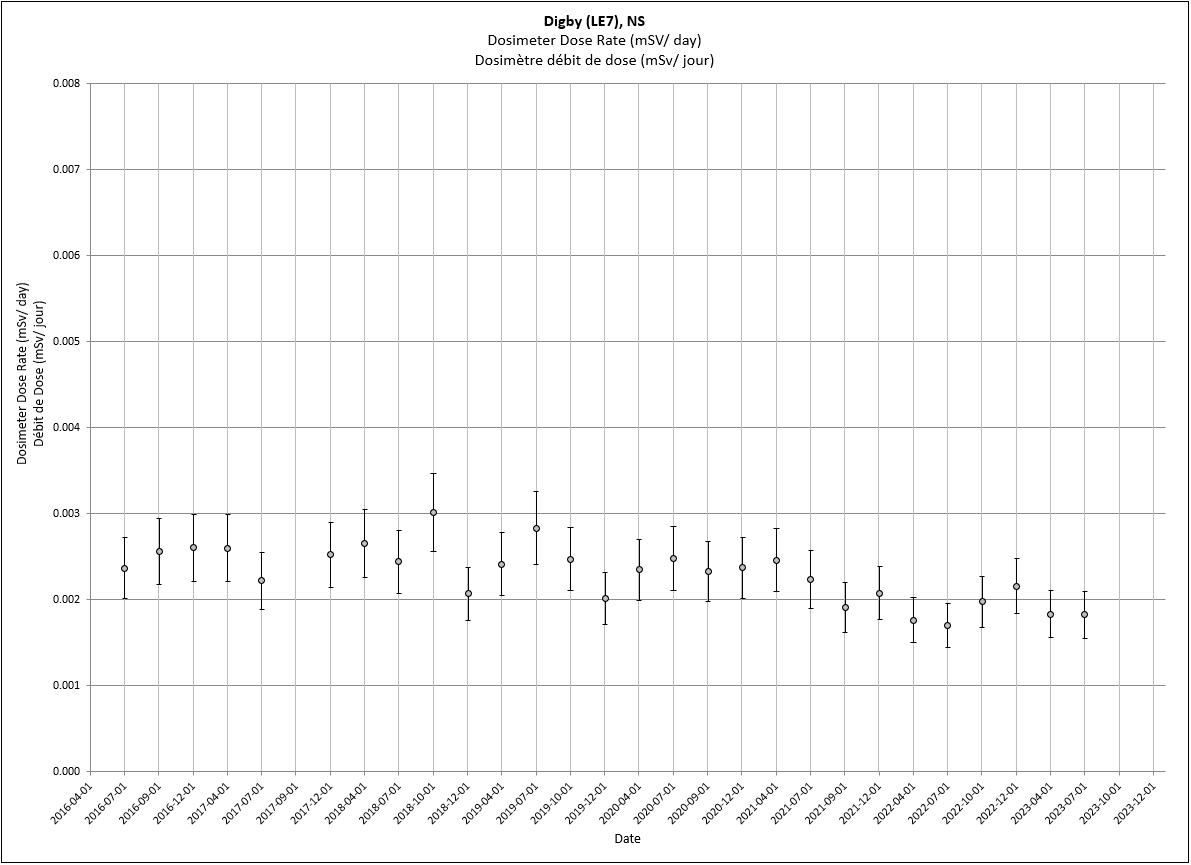
Text description
The above graph shows the background dose rate for Digby, NS, from 2016 to present. The entire data set can be found in nms_environmental_dosimetry_ssn_dosimetrie_environnementale.csv. If you require a copy of this data in a specific accessible format, please contact us at hc.rpb-brp.sc@canada.ca.

Text description
The above graph shows the background dose rate for Greenwood, NS, from 2016 to present. The entire data set can be found in nms_environmental_dosimetry_ssn_dosimetrie_environnementale.csv. If you require a copy of this data in a specific accessible format, please contact us at hc.rpb-brp.sc@canada.ca.
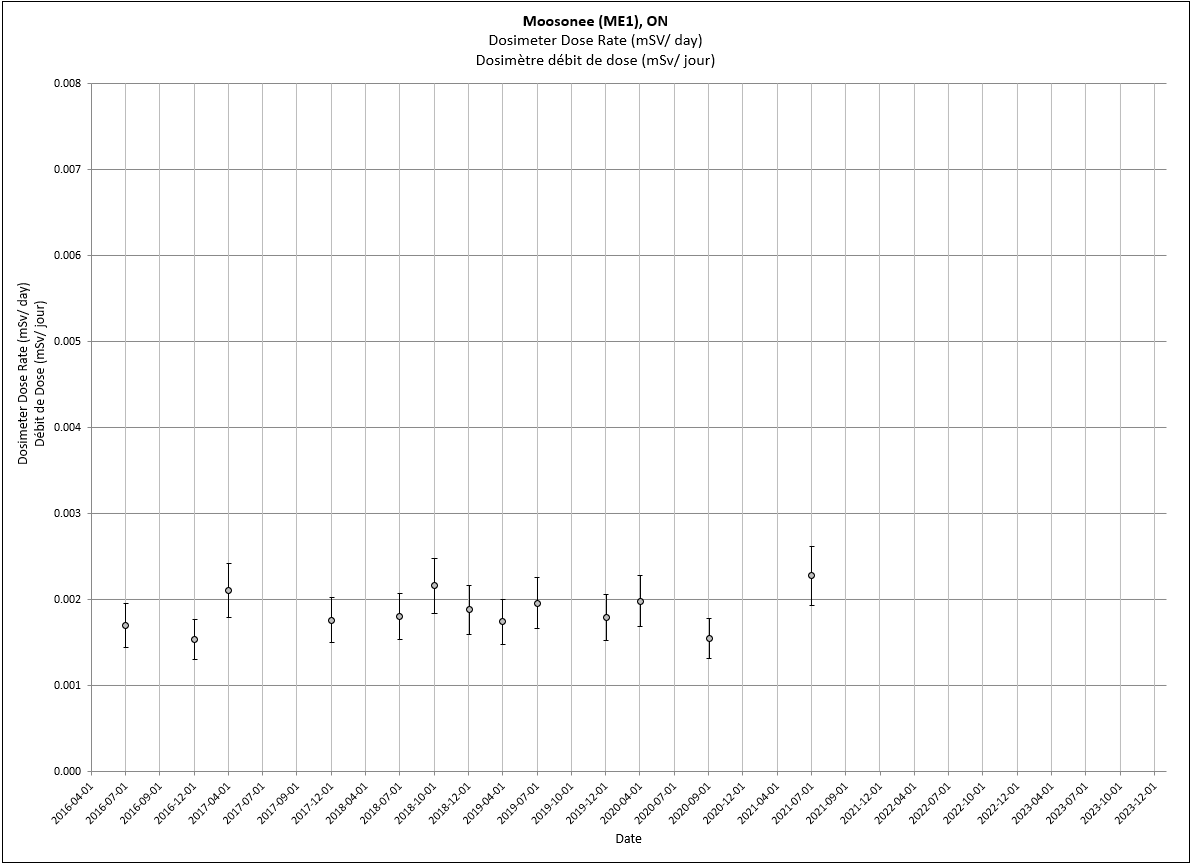
Text description
The above graph shows the background dose rate for Moosonee, ON, from 2016 to present. The entire data set can be found in nms_environmental_dosimetry_ssn_dosimetrie_environnementale.csv. If you require a copy of this data in a specific accessible format, please contact us at hc.rpb-brp.sc@canada.ca.
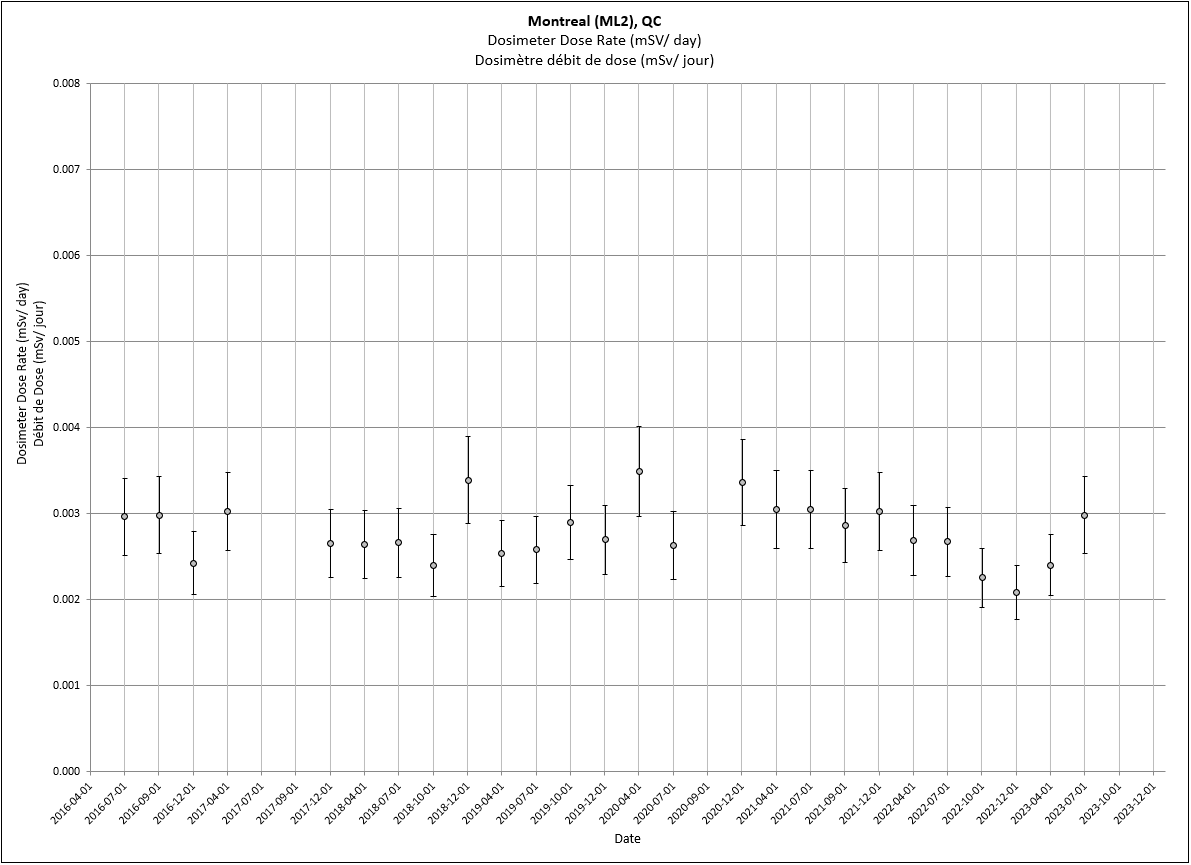
Text description
The above graph shows the background dose rate for Montreal, QC, from 2016 to present. The entire data set can be found in nms_environmental_dosimetry_ssn_dosimetrie_environnementale.csv. If you require a copy of this data in a specific accessible format, please contact us at hc.rpb-brp.sc@canada.ca.
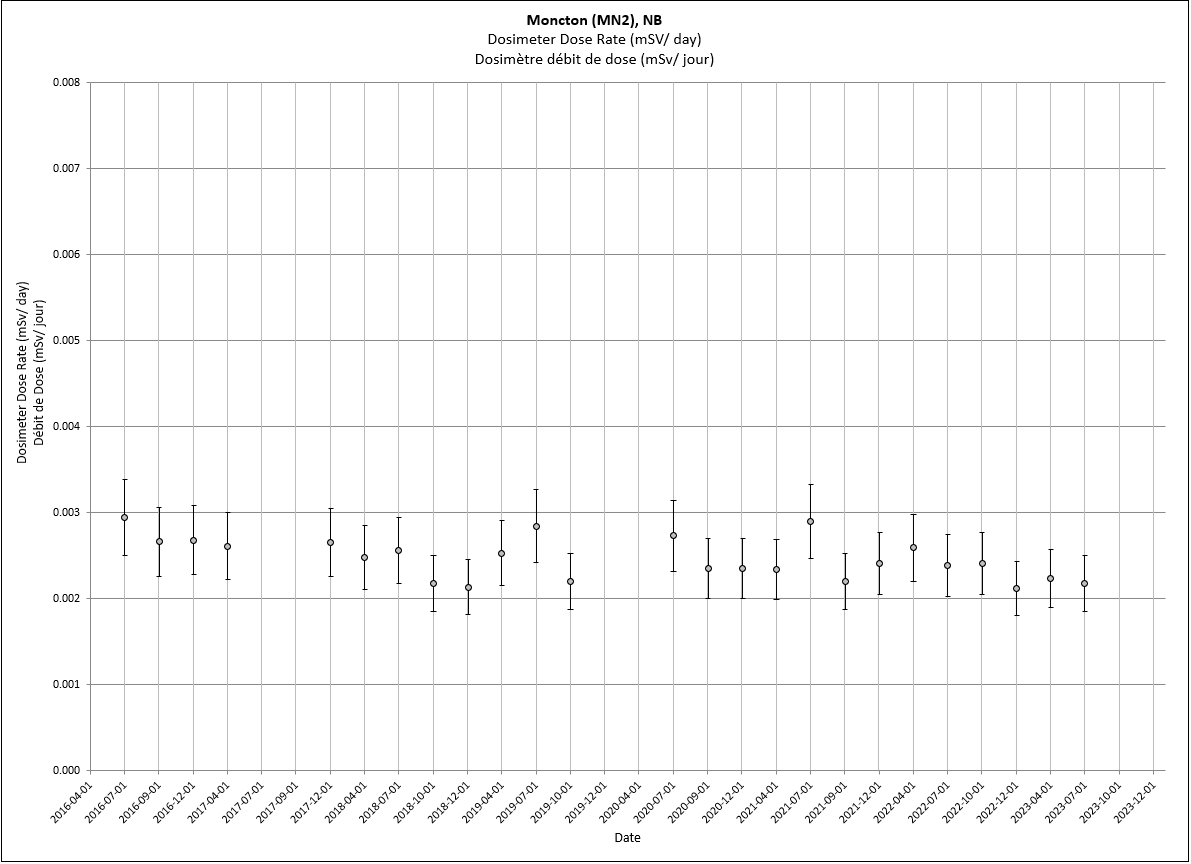
Text description
The above graph shows the background dose rate for Moncton, NB, from 2016 to present. The entire data set can be found in nms_environmental_dosimetry_ssn_dosimetrie_environnementale.csv. If you require a copy of this data in a specific accessible format, please contact us at hc.rpb-brp.sc@canada.ca.
Text description
The above graph shows the background dose rate for the Radiation Protection Bureau, ON, from 2016 to present. The entire data set can be found in nms_environmental_dosimetry_ssn_dosimetrie_environnementale.csv. If you require a copy of this data in a specific accessible format, please contact us at hc.rpb-brp.sc@canada.ca.

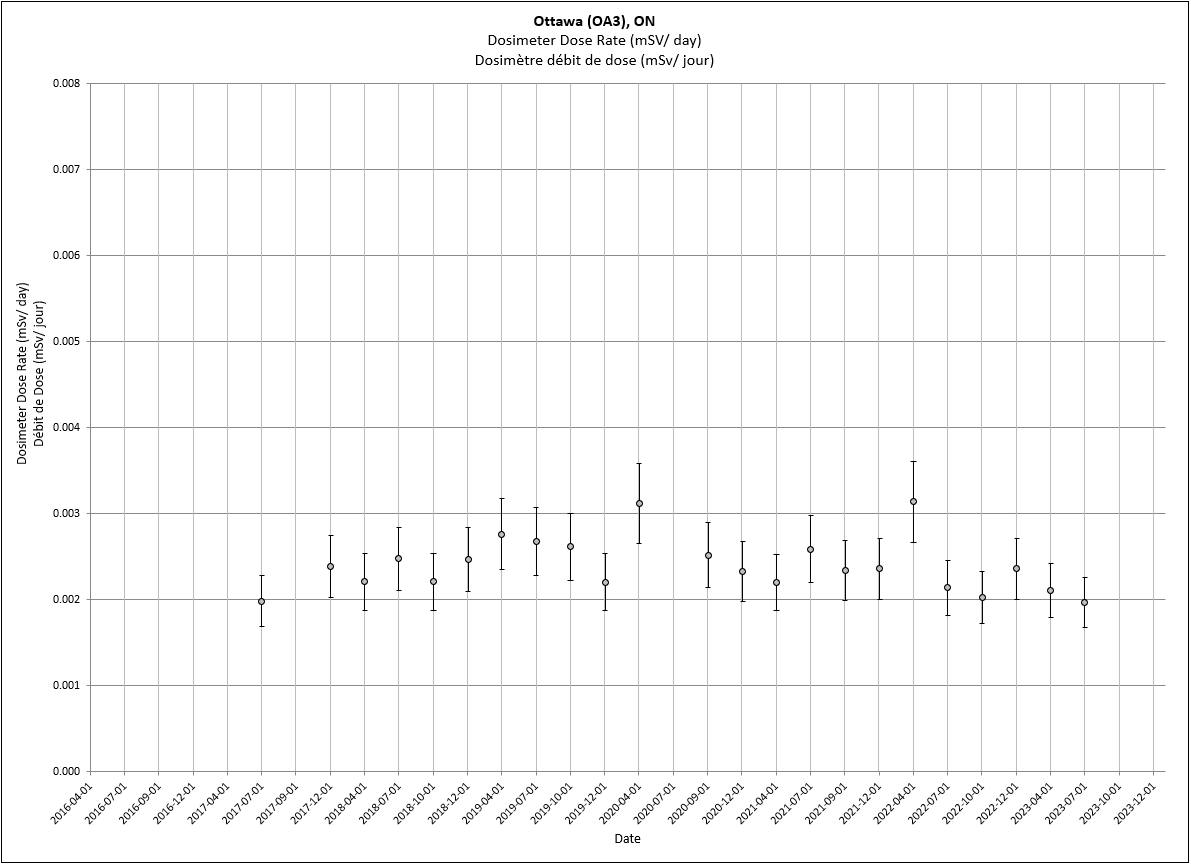
Text description
The above graph shows the background dose rate for Ottawa, ON, from 2016 to present. The entire data set can be found in nms_environmental_dosimetry_ssn_dosimetrie_environnementale.csv. If you require a copy of this data in a specific accessible format, please contact us at hc.rpb-brp.sc@canada.ca.
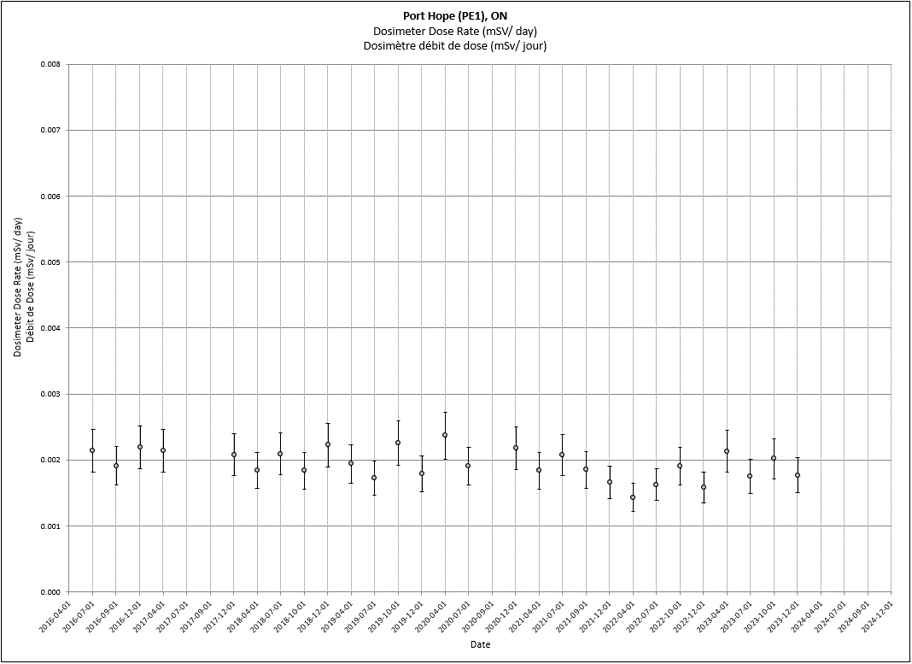
Text description
The above graph shows the background dose rate for Port Hope, ON, from 2016 to present. The entire data set can be found in nms_environmental_dosimetry_ssn_dosimetrie_environnementale.csv. If you require a copy of this data in a specific accessible format, please contact us at hc.rpb-brp.sc@canada.ca.
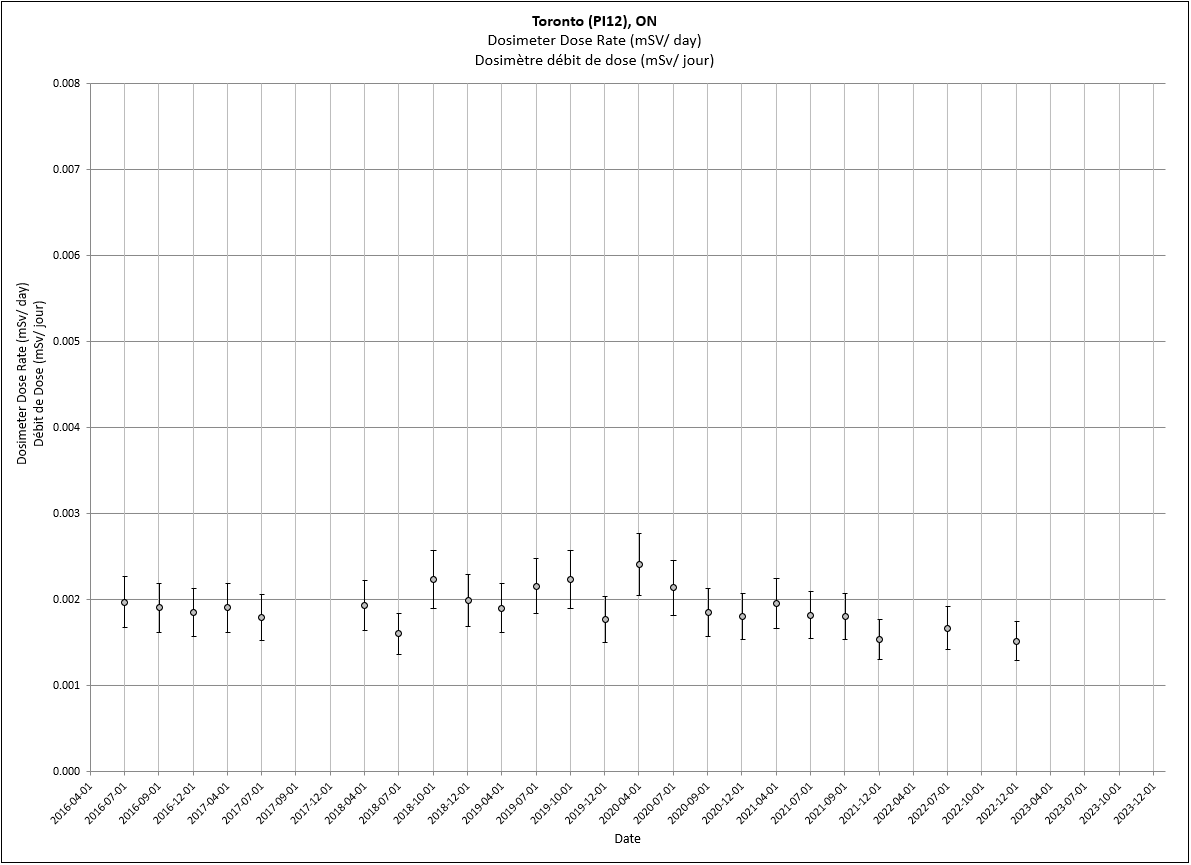
Text description
The above graph shows the background dose rate for Toronto, ON, from 2016 to present. The entire data set can be found in nms_environmental_dosimetry_ssn_dosimetrie_environnementale.csv. If you require a copy of this data in a specific accessible format, please contact us at hc.rpb-brp.sc@canada.ca.
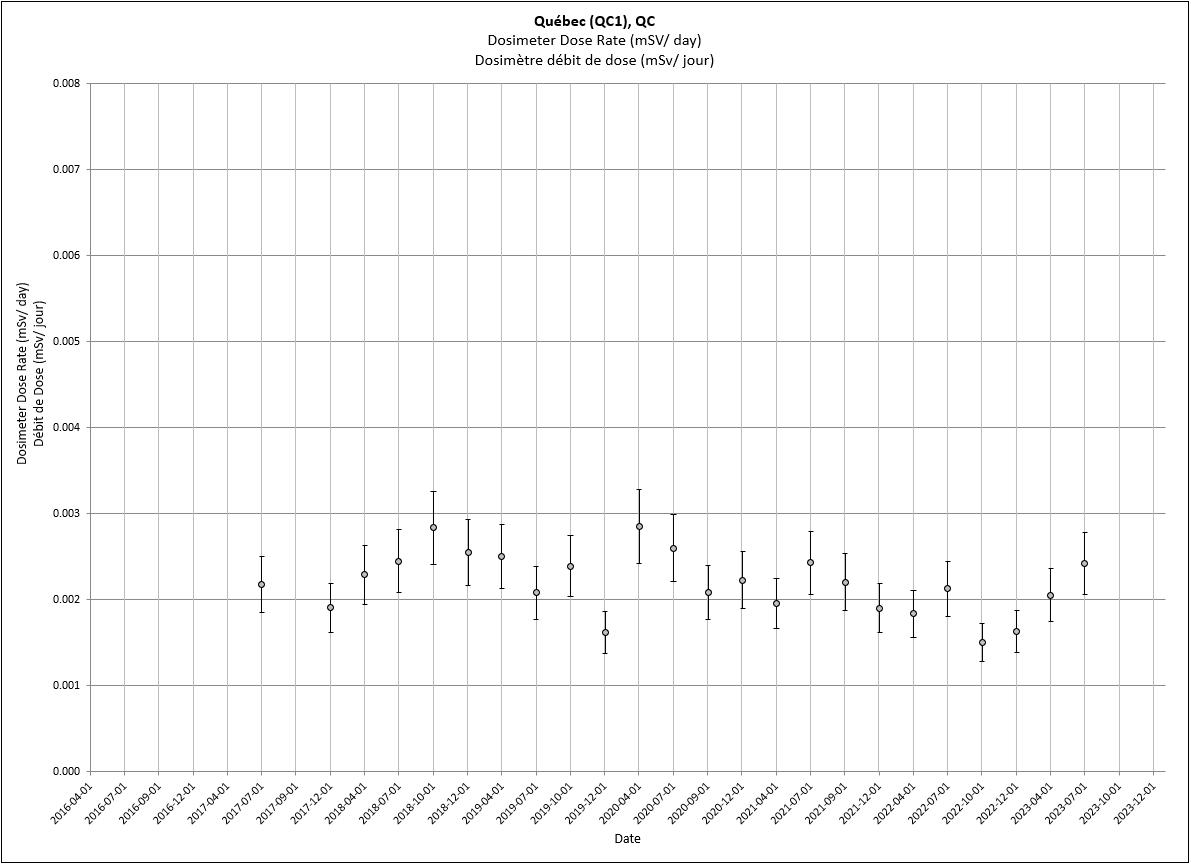
Text description
The above graph shows the background dose rate for Quebec, QC, from 2016 to present. The entire data set can be found in nms_environmental_dosimetry_ssn_dosimetrie_environnementale.csv. If you require a copy of this data in a specific accessible format, please contact us at hc.rpb-brp.sc@canada.ca.
Text description
The above graph shows the background dose rate for Resolute, NU, from 2016 to present. The entire data set can be found in nms_environmental_dosimetry_ssn_dosimetrie_environnementale.csv. If you require a copy of this data in a specific accessible format, please contact us at hc.rpb-brp.sc@canada.ca.
29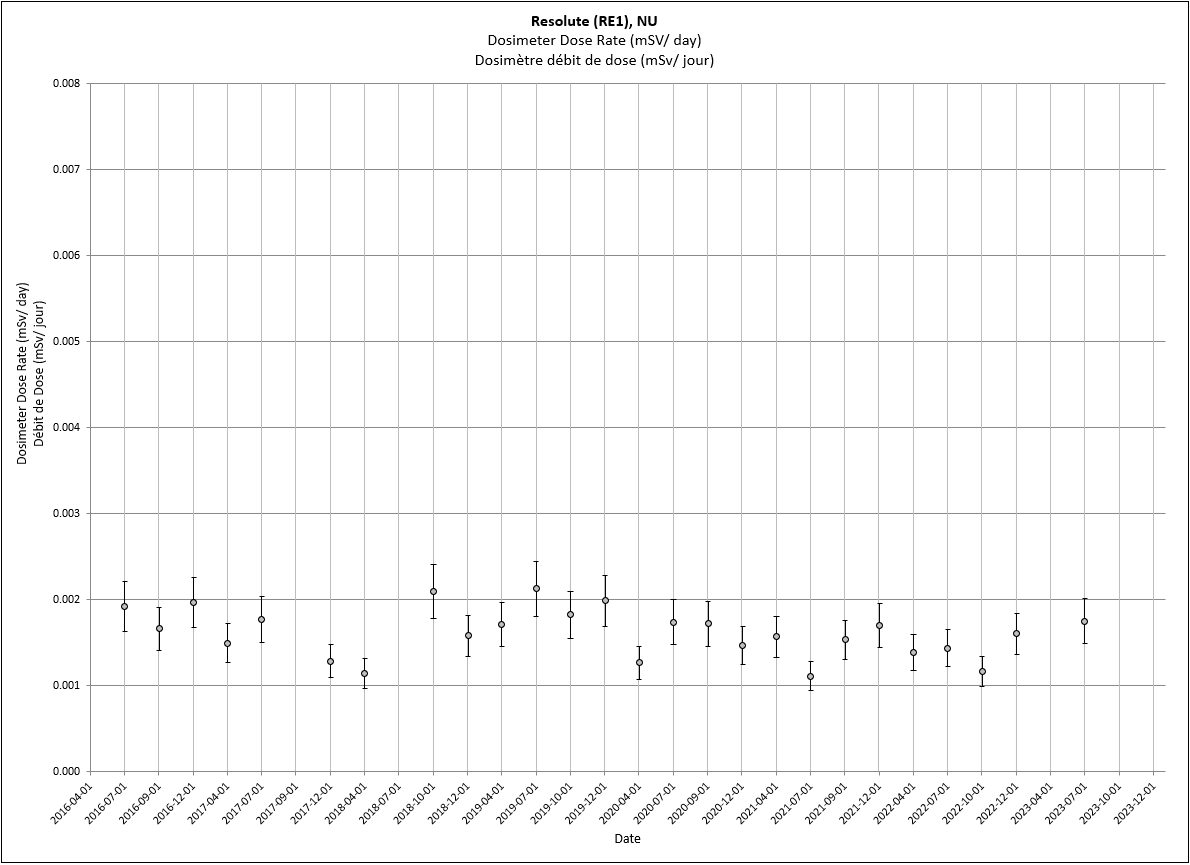
Text description
The above graph shows the background dose rate for Saskatoon, SK, from 2016 to present. The entire data set can be found in nms_environmental_dosimetry_ssn_dosimetrie_environnementale.csv. If you require a copy of this data in a specific accessible format, please contact us at hc.rpb-brp.sc@canada.ca.

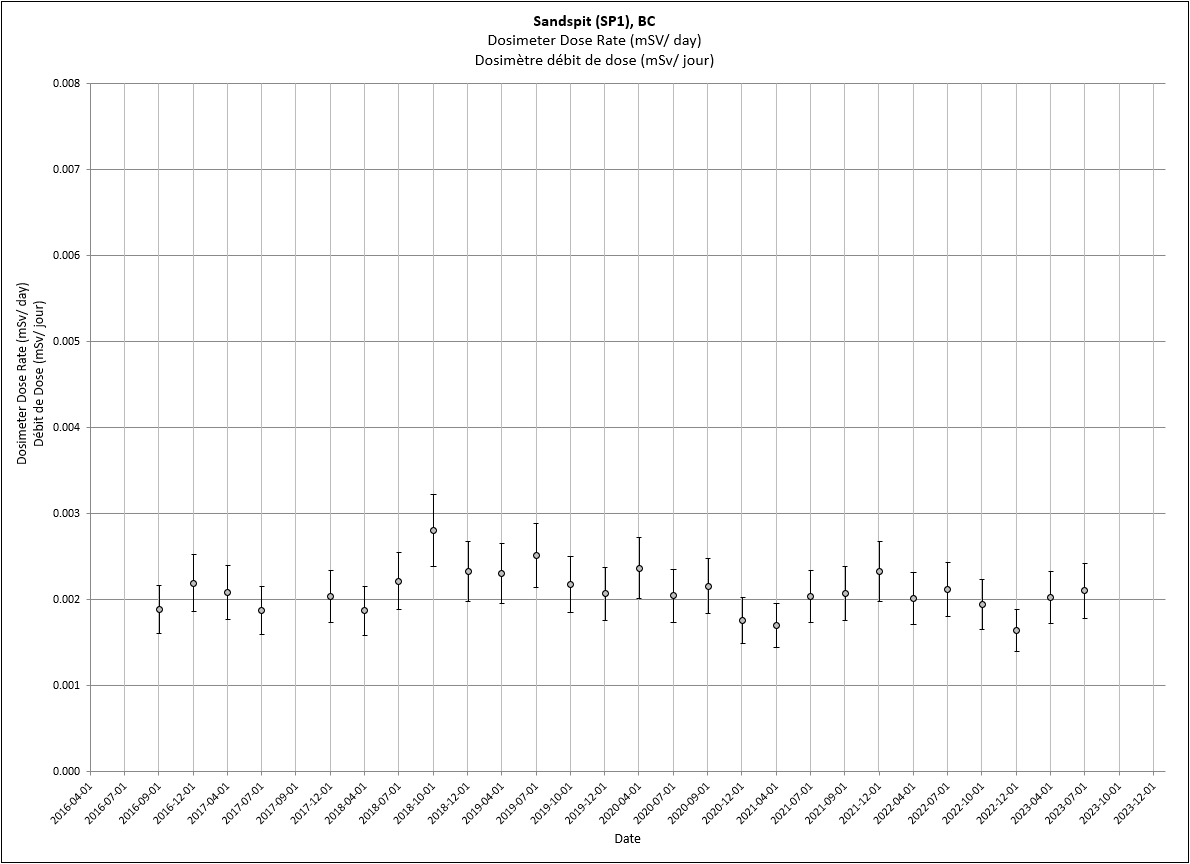
Text description
The above graph shows the background dose rate for Sandspit, BC, from 2016 to present. The entire data set can be found in nms_environmental_dosimetry_ssn_dosimetrie_environnementale.csv. If you require a copy of this data in a specific accessible format, please contact us at hc.rpb-brp.sc@canada.ca.
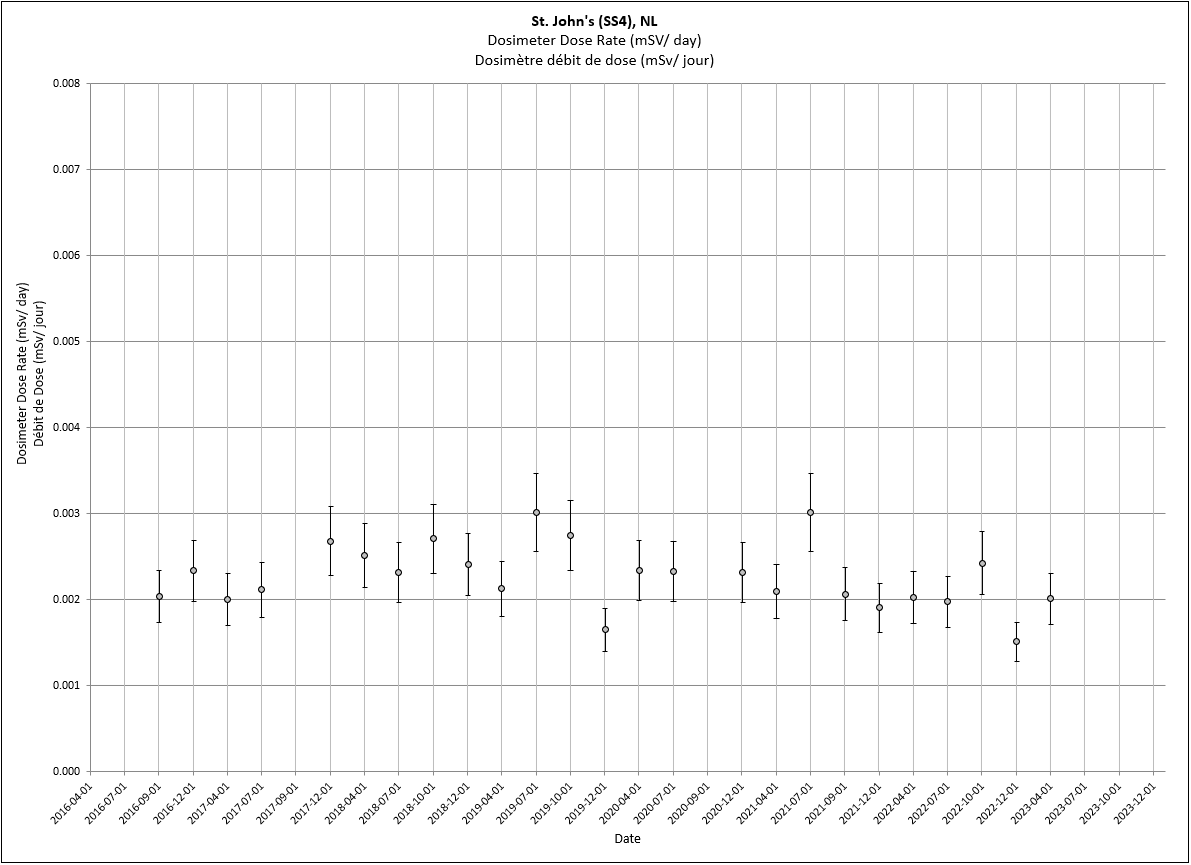
Text description
The above graph shows the background dose rate for St. John's, NL, from 2016 to present. The entire data set can be found in nms_environmental_dosimetry_ssn_dosimetrie_environnementale.csv. If you require a copy of this data in a specific accessible format, please contact us at hc.rpb-brp.sc@canada.ca.
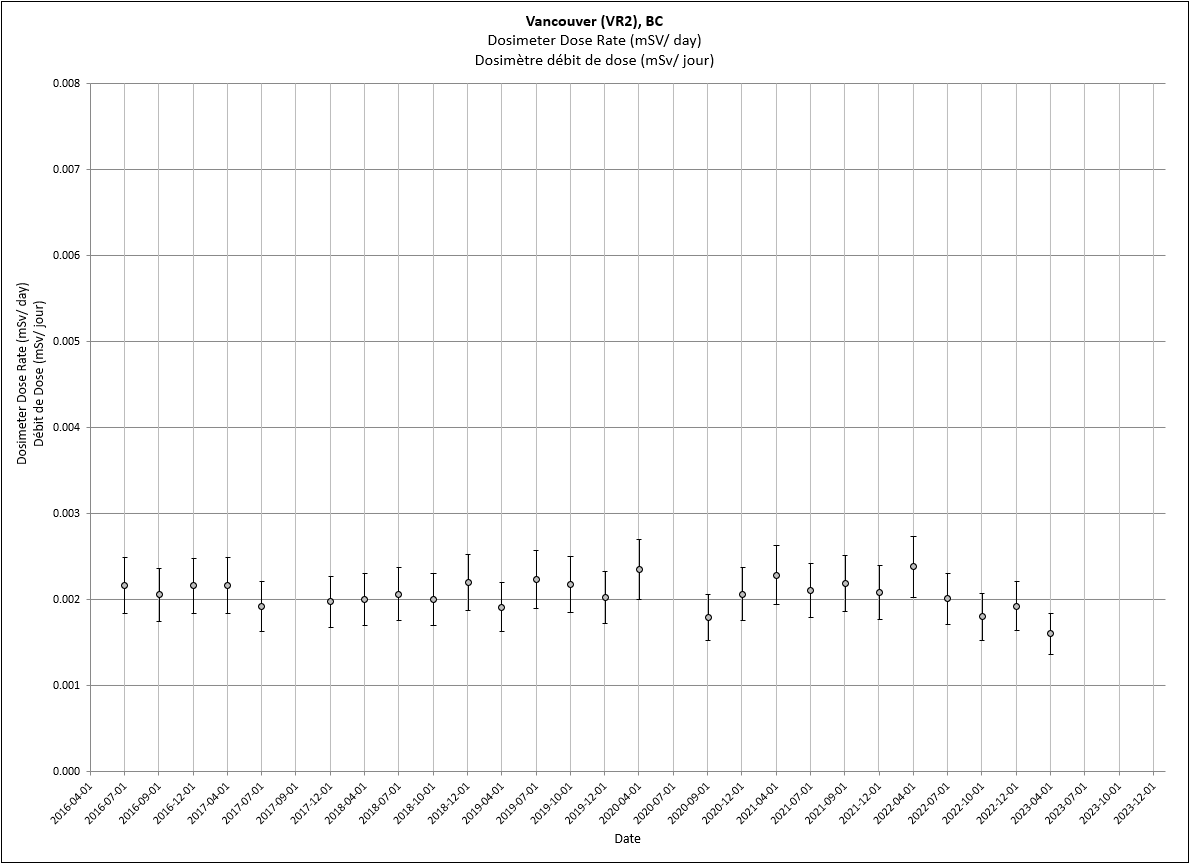
Text description
The above graph shows the background dose rate for Vancouver, BC, from 2016 to present. The entire data set can be found in nms_environmental_dosimetry_ssn_dosimetrie_environnementale.csv. If you require a copy of this data in a specific accessible format, please contact us at hc.rpb-brp.sc@canada.ca.
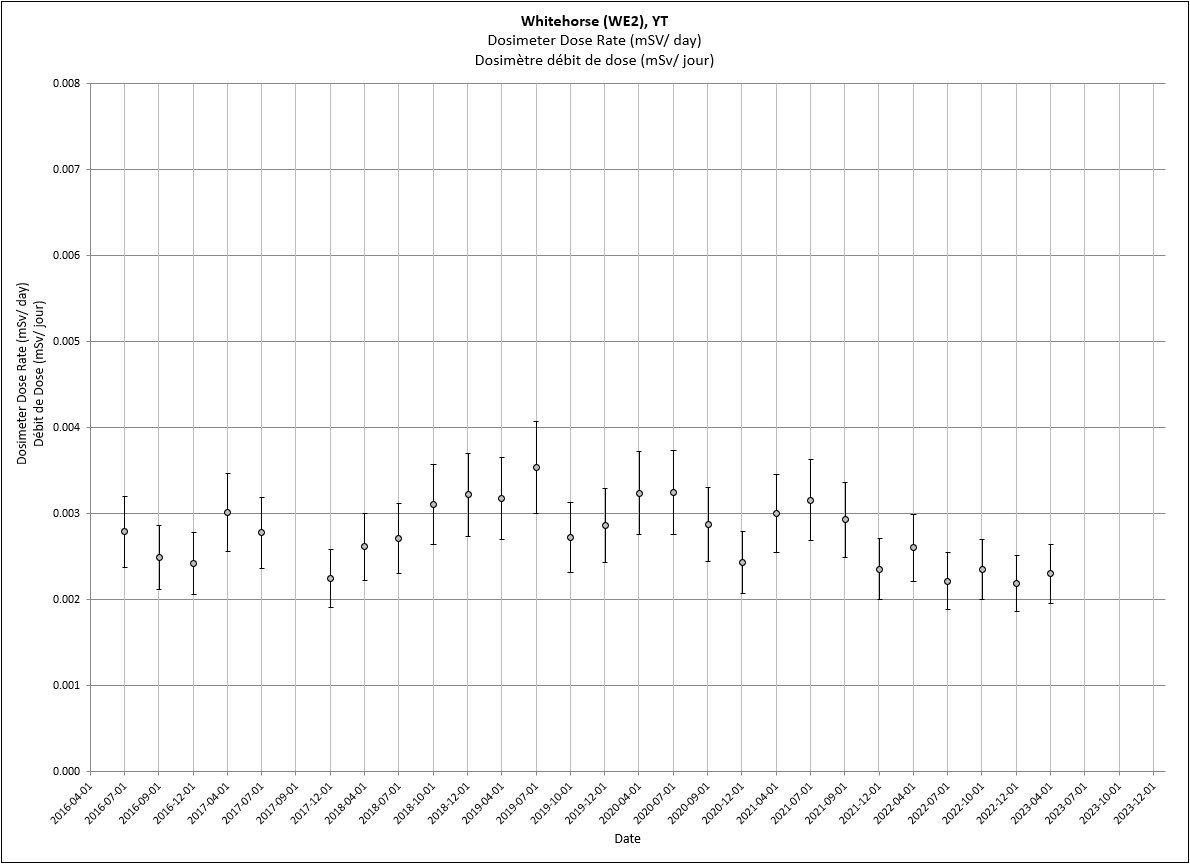
Text description
The above graph shows the background dose rate for Whitehorse, YT, from 2016 to present. The entire data set can be found in nms_environmental_dosimetry_ssn_dosimetrie_environnementale.csv. If you require a copy of this data in a specific accessible format, please contact us at hc.rpb-brp.sc@canada.ca.
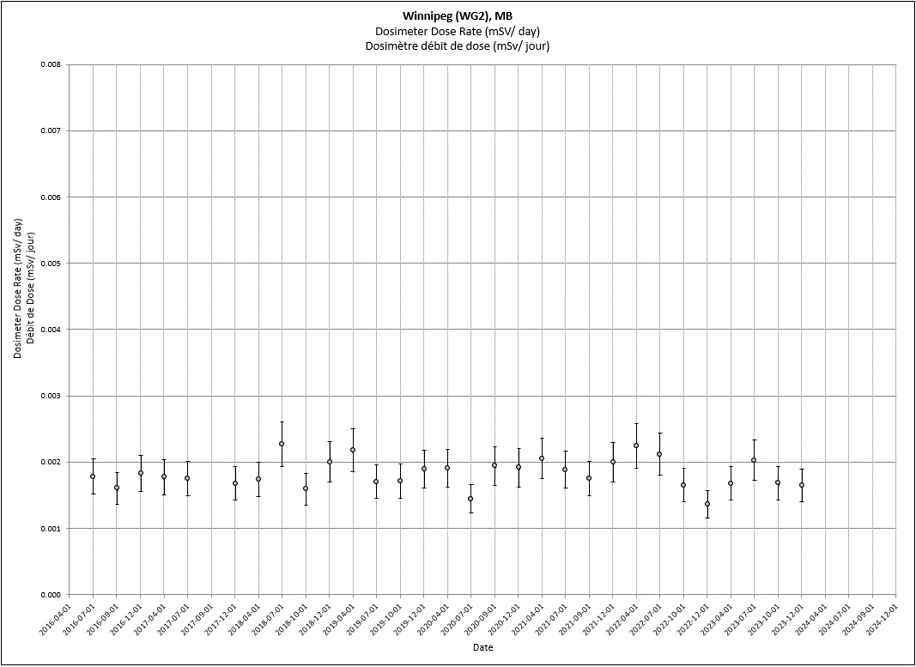
Text description
The above graph shows the background dose rate for Winnipeg, MB, from 2016 to present. The entire data set can be found in nms_environmental_dosimetry_ssn_dosimetrie_environnementale.csv. If you require a copy of this data in a specific accessible format, please contact us at hc.rpb-brp.sc@canada.ca.
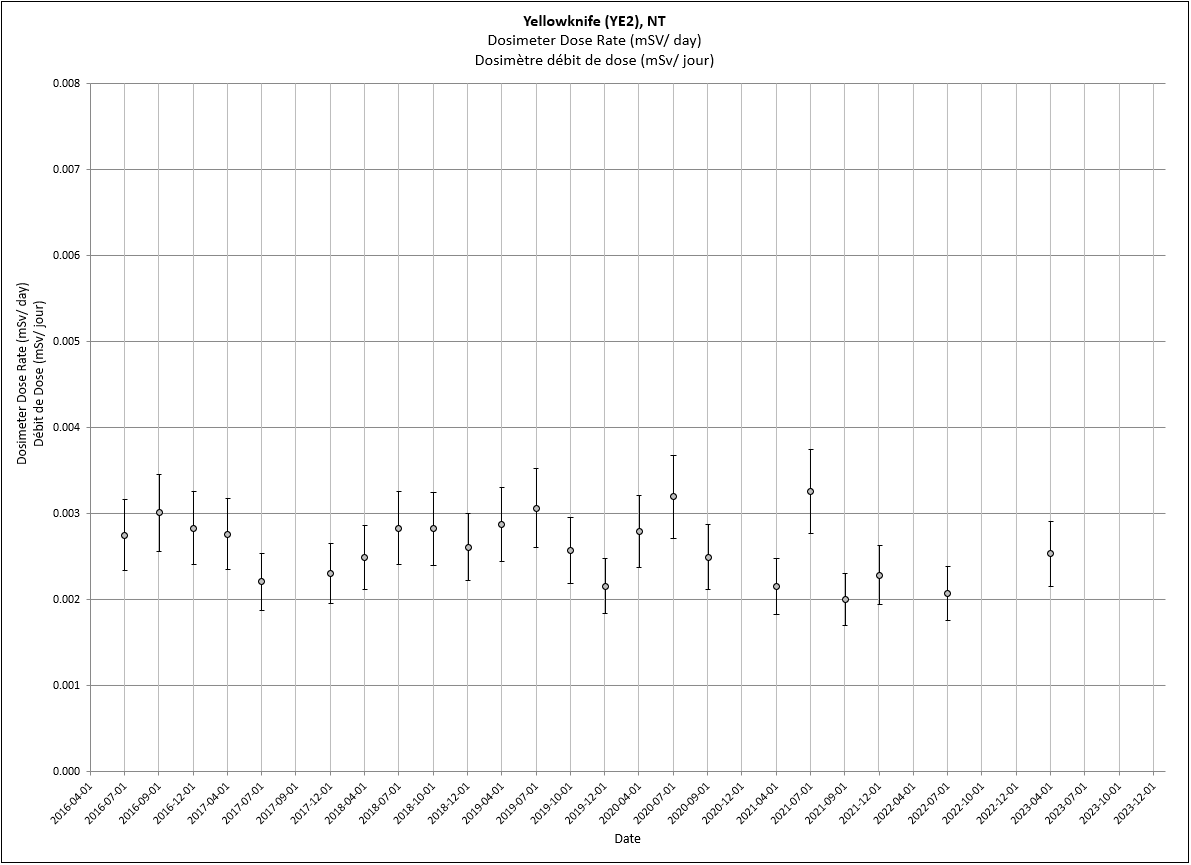
Text description
The above graph shows the background dose rate for Yellowknife, NT, from 2016 to present. The entire data set can be found in nms_environmental_dosimetry_ssn_dosimetrie_environnementale.csv. If you require a copy of this data in a specific accessible format, please contact us at hc.rpb-brp.sc@canada.ca.
Text description
The above graph shows the background dose rate for all CRMN dosimetry stations, from 2016 to present. The entire data set can be found in nms_environmental_dosimetry_ssn_dosimetrie_environnementale.csv. If you require a copy of this data in a specific accessible format, please contact us at hc.rpb-brp.sc@canada.ca.